
FIGURE
FIGURE 2
- ID
- ZDB-FIG-220515-9
- Publication
- Gegner et al., 2022 - Deep Metabolic Profiling Assessment of Tissue Extraction Protocols for Three Model Organisms
- Other Figures
- All Figure Page
- Back to All Figure Page
FIGURE 2
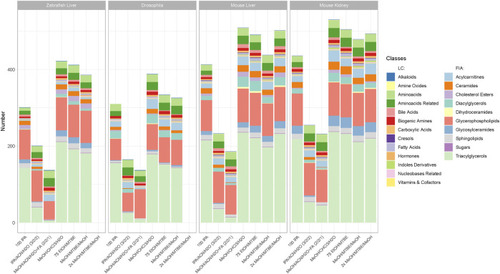
Metabolite coverage per extraction protocol across all sample types and model organisms. Indicated by color are the different metabolite classes measured. A metabolite was counted as detectable when at least 2 out of 3 replicates were >LOD within a given extraction protocol. The legend is categorized between compound classes measured |
Expression Data
Expression Detail
Antibody Labeling
Phenotype Data
Phenotype Detail
Acknowledgments
This image is the copyrighted work of the attributed author or publisher, and
ZFIN has permission only to display this image to its users.
Additional permissions should be obtained from the applicable author or publisher of the image.
Full text @ Front Chem