
- Title
-
Deep Metabolic Profiling Assessment of Tissue Extraction Protocols for Three Model Organisms
- Authors
- Gegner, H.M., Mechtel, N., Heidenreich, E., Wirth, A., Cortizo, F.G., Bennewitz, K., Fleming, T., Andresen, C., Freichel, M., Teleman, A.A., Kroll, J., Hell, R., Poschet, G.
- Source
- Full text @ Front Chem

Overview of the seven extraction protocols used as well as the model organisms and sample types investigated. The protocols increase in handling effort and complexity from left to right. The color code indicates similarities amongst the protocols either through solvents or chemicals used. All extraction products were stored at −80°C until further processing. A list of abbreviations can be found above. |
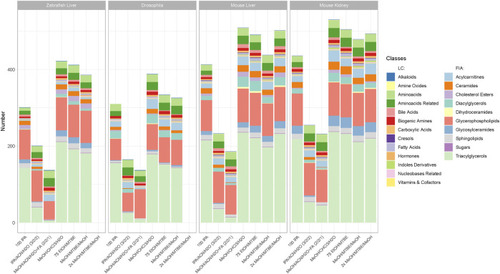
Metabolite coverage per extraction protocol across all sample types and model organisms. Indicated by color are the different metabolite classes measured. A metabolite was counted as detectable when at least 2 out of 3 replicates were >LOD within a given extraction protocol. The legend is categorized between compound classes measured |

Number of metabolites per class with the highest concentration per extraction protocol across all sample types and model organisms. Metabolites that appear in the bar chart are only counted when they produce the highest or a non-significantly lower concentration ( |

Variability of extraction procedures across all sample types and model organisms. Indicated by color are the different extraction protocols used. The CV% was generated based on the triplicate analyses. For each of the CV% categories the percentage of the total 630 metabolites. Note that |

Venn diagram showing number of metabolites that are common or unique across all sample types and model organisms within the |