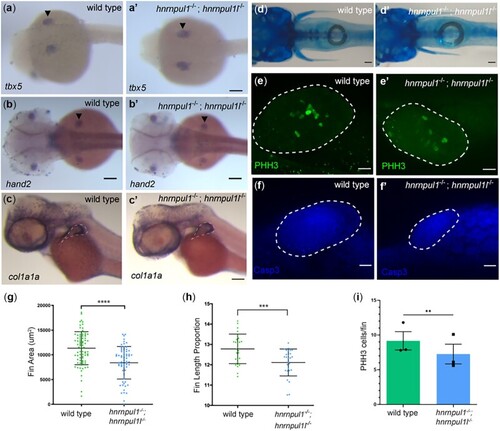
Loss of hnrnpul1 and hnrnpul1l does not affect fin specification, but leads to decreased fin growth in embryos and larvae. a–c) mRNA expression of fin specification markers tbx5 (a, a’) at 24 hpf, and hand2 (b, b’) at 48 hpf in wild type (a, b) and hnrnpul1/1l mutant (a’, b’) embryos. c, c’) mRNA expression of col1a1a in wild type and hnrnpul1/1l mutant embryos at 48 hpf. Dashed line shows outside edge of staining where fin size was measured. d, d’) Alcian blue cartilage staining of wild type and hnrnpul1/1l mutant fish at 16 dpf. e, e’) PHH3 staining of wild type and hnrnpul1/1l mutant fins at 48 hpf. f, f’) Activated Caspase 3 (Casp3) immunostaining in wild type and hnrnpul1/1l mutant fins at 48 hpf. Dotted lines show the fin boundary. g) Quantification of fin area in wild type and hnrnpul1/1l mutant col1a1a stained embryos at 48 hpf. Wild type n = 79, hnrnpul1/1l n= 68, from 2 trials. h) Quantification of fin length at 16 dpf as a percentage of body length. Wild type n = 28, hnrnpul1/1l n = 27, from 2 trials. i) Quantification of proliferation via PHH3 immunostaining in wild type and hnrnpul1/1l mutant fins at 48 hpf, n = 30 fins, from 3 trials. **P ≤ 0.01, ***P ≤ 0.001, ****P ≤ 0.0001, ns = P > 0.05, determined using Student’s t-test. Scale bars: a–d’ = 100 µm, e–f’ = 20 µm.
|
