|
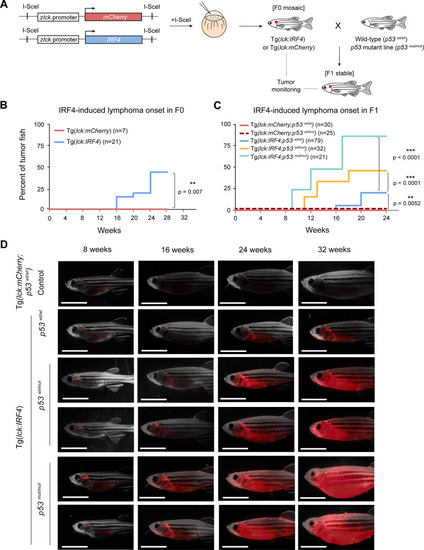
Overexpression of wild-type <italic>IRF4</italic> induces tumors in zebrafish.A Schematic diagram of the experimental procedure used to overexpress the human IRF4 gene under the zebrafish lck promoter. B Tumor onset in F0 animals was analyzed in the control Tg(lck:mCherry) (n = 7) and Tg(lck:IRF4) transgenic (n = 21) groups; p = 0.007 according to the Gehan-Breslow-Wilcoxon test. C Tumor onset in F1 animals was analyzed in the control Tg(lck:mCherry;p53wt/wt) (n = 30), Tg(lck:mCherry;p53wt/mut) (n = 25), Tg(lck:IRF4;p53wt/wt) (n = 79), Tg(lck:IRF4;p53wt/mut) (n = 32) and Tg(lck:IRF4;p53mut/mut) (n = 21) groups. p = 0.0052 for Tg(lck:mCherry;p53wt/wt) or Tg(lck:mCherry;p53wt/mut) vs Tg(lck:IRF4;p53wt/wt); p < 0.0001 for Tg(lck:IRF4;p53wt/wt) vs Tg(lck:IRF4;p53wt/mut); and p < 0.0001 for Tg(lck:IRF4;p53wt/wt) vs Tg(lck:IRF4;p53mut/mut) according to the Gehan-Breslow-Wilcoxon test. D Representative microscopy images of F1 animals: control Tg(lck:mCherry;p53wt/wt), Tg(lck:IRF4;p53wt/wt), Tg(lck:IRF4;p53wt/mut) and Tg(lck:IRF4;p53mut/mut) zebrafish at 8, 16, 24, and 32 weeks postfertilization. Panels show merged fluorescence and brightfield images. Scale bar = 4 mm. Source data are provided as a Source Data file.
|