FIGURE SUMMARY
Title

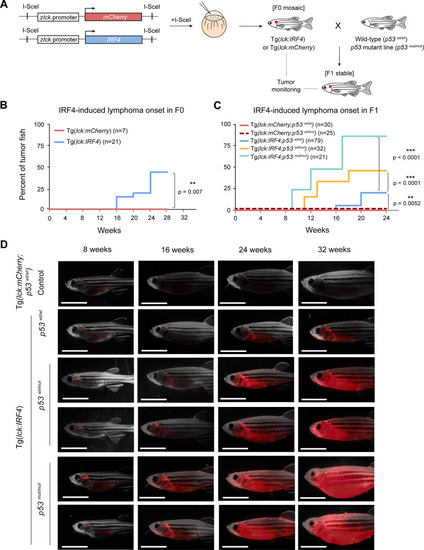
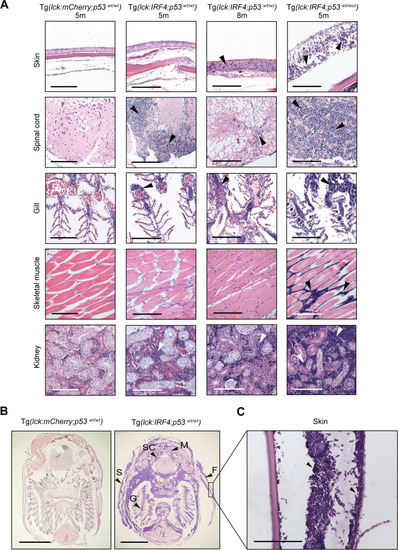
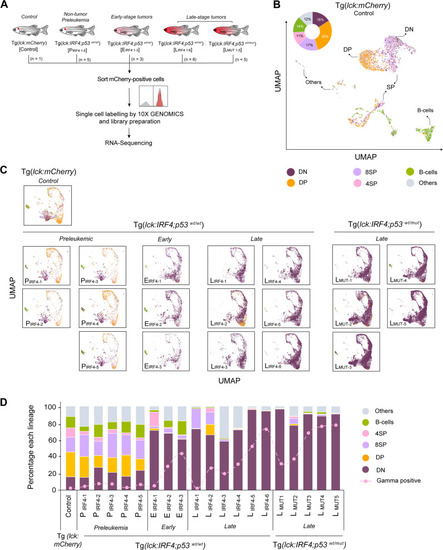
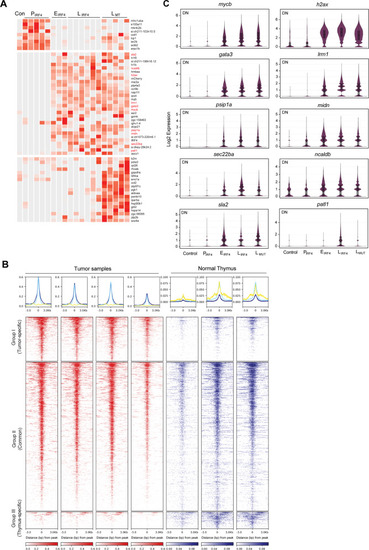
IRF4 drives clonal evolution and lineage choice in a zebrafish model of T-cell lymphoma

Authors
Amanda, S., Tan, T.K., Ong, J.Z.L., Theardy, M.S., Wong, R.W.J., Huang, X.Z., Ali, M.Z., Li, Y., Gong, Z., Inagaki, H., Foo, E.Y., Pang, B., Tan, S.Y., Iida, S., Sanda, T.
Source
Full text @ Nat. Commun.

Overexpression of wild-type <italic>IRF4</italic> induces tumors in zebrafish.

A Schematic diagram of the experimental procedure used to overexpress the human IRF4 gene under the zebrafish lck promoter. B Tumor onset in F0 animals was analyzed in the control Tg(lck:mCherry) (n = 7) and Tg(lck:IRF4) transgenic (n = 21) groups; p = 0.007 according to the Gehan-Breslow-Wilcoxon test. C Tumor onset in F1 animals was analyzed in the control Tg(lck:mCherry;p53wt/wt) (n = 30), Tg(lck:mCherry;p53wt/mut) (n = 25), Tg(lck:IRF4;p53wt/wt) (n = 79), Tg(lck:IRF4;p53wt/mut) (n = 32) and Tg(lck:IRF4;p53mut/mut) (n = 21) groups. p = 0.0052 for Tg(lck:mCherry;p53wt/wt) or Tg(lck:mCherry;p53wt/mut) vs Tg(lck:IRF4;p53wt/wt); p < 0.0001 for Tg(lck:IRF4;p53wt/wt) vs Tg(lck:IRF4;p53wt/mut); and p < 0.0001 for Tg(lck:IRF4;p53wt/wt) vs Tg(lck:IRF4;p53mut/mut) according to the Gehan-Breslow-Wilcoxon test. D Representative microscopy images of F1 animals: control Tg(lck:mCherry;p53wt/wt), Tg(lck:IRF4;p53wt/wt), Tg(lck:IRF4;p53wt/mut) and Tg(lck:IRF4;p53mut/mut) zebrafish at 8, 16, 24, and 32 weeks postfertilization. Panels show merged fluorescence and brightfield images. Scale bar = 4 mm. Source data are provided as a Source Data file.

<italic>IRF4</italic>-driven zebrafish tumors recapitulate invasive human T-cell lymphoma.

A Histopathological examination of H&E-stained tissue sections of representative samples from control Tg(lck:mCherry;p53wt/wt) (n = 8), Tg(lck:IRF4;p53wt/wt) (n = 8) and Tg(lck:IRF4;p53wt/mut) (n = 4) zebrafish at 5 or 8 months. Similar findings were observed in multiple independent animals as shown for each sample. Tumor cells are indicated by white or black arrowheads. Scale bar = 100 μm. B Transverse sections of representative samples from Tg(lck:mCherry;p53wt/wt) (n = 8) and Tg(lck:IRF4;p53wt/wt) (n = 8). F, fin; G, gill; M, muscle; S, skin; and SC, spinal cord. Similar findings were observed in multiple independent animals as shown for each sample. Scale bar = 2 mm. C High magnification of skin lesions from Tg(lck:IRF4;p53wt/wt) fish. Scale bar = 100 μm.

Identification of multiple cell populations derived from different stages of lymphocyte differentiation.

A Schematic diagram of the sample preparation for scRNA-seq analysis. B UMAP plot showing T and B lymphocytes from one control zebrafish. We first selected T and B-cell clusters and then performed a subclustering analysis. Six populations were then defined based on marker gene expression. C UMAP plots showing aggregated cells from 20 independent zebrafish. Six populations were annotated using the same criteria used in (B). D Bar charts showing the percentage of different cell populations in each sample. Source data are provided as a Source Data file.

IRF4-driven tumor cells possess malignant features.

A Representative microscopy images of three recipient fish at 1, 2, 3, and 4 weeks after the first transplantation. Panels show merged fluorescence and brightfield images. Scale bar = 4 mm. B Table showing the engraftment rate of five independent donor tumor fish. C Gene expression pattern of the tcr-γ variable regions in eight representative samples. The cells in the UMAP plot are colored by the marker gene expression level. D Pie charts showing the percentage of mono-, oligo-, and polyclonal tumors analyzed by qRT-PCR in three different genotype settings. Source data are provided as a Source Data file.

IRF4-driven tumors are characterized by high expression of <italic>mycb</italic> and <italic>gata3</italic>.

A Heatmap showing the significantly upregulated genes from one-to-one differential gene analysis of scRNA-seq data between DN populations of different tumor stages. B Density plots (bottom) show the distribution of H3K27ac signals in tumor and normal thymus samples. All significant peaks (FDR < 0.05) were first detected and then classified into three classes of regions (Groups I-III). The color scale represents the intensity of signals and distances (3,000 bps) from the center (0) of peaks. Metagene plots (top) show the distribution of H3K27ac signals from the center for Group I (log2FC ≥ 1) (blue), Group II (−1 < log2FC < 1) (light blue) and Group III (log2FC ≤ −1) (yellow) regions. C Violin plots showing the expression of ten genes in DN cell populations across tumor stages analyzed by scRNA-seq (total cell number after merging of biologically independent samples: Control n = 557 cells; PIRF4n = 2,222 cells; EIRF4n = 3,365; LIRF4n = 15,280 cells; LMTn = 28,205 cells). Black vertical line indicates max and min values. Box indicates the third and first quartiles. Horizontal lines in the box indicate mean and median values. Source data are provided as a Source Data file.

Downregulation of p53 targets and <italic>id3</italic>.

A Heatmap showing the significantly downregulated genes from one-to-one differential gene analysis of scRNA-seq data between DN populations of different tumor stages. BD Violin plots showing the expression of btg1, btg2 and stk17al (B), mcl1a (C), id3 (D) in DN cell populations across tumor stages analyzed by scRNA-seq (total cell number after merging of biologically independent samples: Control n = 557 cells; PIRF4n = 2,222 cells; EIRF4n = 3,365; LIRF4n = 15,280 cells; LMTn = 28,205 cells). See Fig. 5C legend for the details of violin plots. Source data are provided as a Source Data file.

<italic>IRF4</italic>-driven T-cell tumors are sensitive to a small-molecule BRD inhibitor.

A Representative microscopy images of Tg(lck:IRF4;p53wt/wt) transgenic fish treated with vehicle (DMSO; n = 5) or JQ1 (4 μM; n = 5). Panels show merged fluorescence and brightfield images. Scale bar = 4 mm. B Quantification of tumor volume for five independent animals on days 1, 2, 5, 7, 8, 12 and 15 compared to that on day 0. Integrated fluorescence intensity was quantified by ImageJ (NIH) software and normalized to body size; *p < 0.05, **p < 0.01, and ***p < 0.001 by two-tailed unpaired Student’s t-tests. Bars indicate mean and SD values. Day 1 p = 0.07; day 2 p = 0.83; day 5 p = 0.04; day 7 p = 7.7 × 10−5; day 8 p = 0.001; day 12 p = 1 × 10−5; day 15 p = 1.7 × 10−5. C Gene set enrichment analysis plots showing the overall pattern of gene expression changes of Group I + II genes upon JQ1 treatment. Each solid bar represents one gene within the gene set. The normalized enrichment scores (NES) by dataset permutations and p-values are indicated. D Bar charts showing the expression level of seven selected genes in control and JQ1-treated samples (n = 3 independent animals for each group). The data represent the mean ± SEM (shown as bars) of replicate samples; *p < 0.05 and **p < 0.01 by two-tailed unpaired Student’s t-tests. Source data are provided as a Source Data file.

Acknowledgments
This image is the copyrighted work of the attributed author or publisher, and ZFIN has permission only to display this image to its users. Additional permissions should be obtained from the applicable author or publisher of the image. Full text @ Nat. Commun.