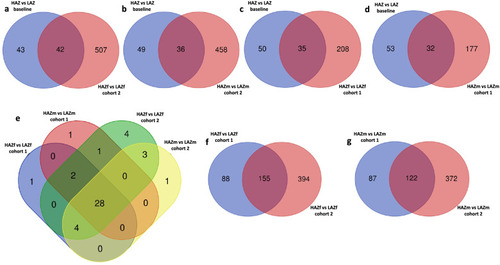
Overlap of differentially expressed genes (DEGs) between high aggression zebrafish (HAZ) and low aggression zebrafish (LAZ) at baseline and after mirror exposure. a Venn diagram showing the overlap of DEGs between the HAZ vs. LAZ comparison at baseline and the comparison of female cohort 2 fish. b Venn diagram showing the overlap of DEGs between the HAZ vs. LAZ comparison at baseline and the comparison of male cohort 2 fish. c Venn diagram showing the overlap of DEGs between the HAZ vs. LAZ comparison at baseline and the comparison of female cohort 1 fish. d Venn diagram showing the overlap of DEGs between the HAZ vs. LAZ comparison at baseline and the comparison of male cohort 1 fish. e Venn diagram depicting common DEGs between the comparisons of male and female cohort 1 and cohort 2 fish. f Venn diagram showing the overlap of DEGs between the comparison of female cohort 1 fish and the comparison of female cohort 2 fish. g Venn diagram showing the overlap of DEGs between the comparison of male cohort 1 fish and the comparison of male cohort 2 fish. For all comparisons, cohort 1 denotes HAZ and LAZ exposed to the mirror for 1h and displaying similar aggression levels, whereas cohort 2 denotes the comparison between the most aggressive HAZ during prolonged mirror exposure and the least aggressive LAZ. Source data and individual data values are available in Additional file 2
|
