IMAGE

Fig. 5

ID
ZDB-IMAGE-220507-7
Source
Figures for Reichmann et al., 2022
Image
Figure Caption

Fig. 5

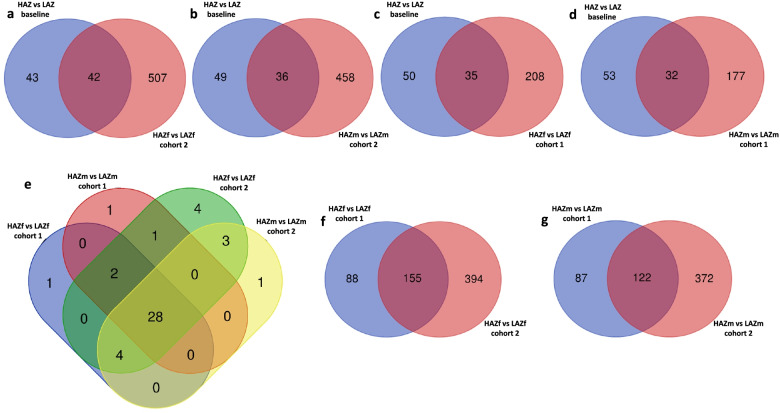
Overlap of differentially expressed genes (DEGs) between high aggression zebrafish (HAZ) and low aggression zebrafish (LAZ) at baseline and after mirror exposure. a Venn diagram showing the overlap of DEGs between the HAZ vs. LAZ comparison at baseline and the comparison of female cohort 2 fish. b Venn diagram showing the overlap of DEGs between the HAZ vs. LAZ comparison at baseline and the comparison of male cohort 2 fish. c Venn diagram showing the overlap of DEGs between the HAZ vs. LAZ comparison at baseline and the comparison of female cohort 1 fish. d Venn diagram showing the overlap of DEGs between the HAZ vs. LAZ comparison at baseline and the comparison of male cohort 1 fish. e Venn diagram depicting common DEGs between the comparisons of male and female cohort 1 and cohort 2 fish. f Venn diagram showing the overlap of DEGs between the comparison of female cohort 1 fish and the comparison of female cohort 2 fish. g Venn diagram showing the overlap of DEGs between the comparison of male cohort 1 fish and the comparison of male cohort 2 fish. For all comparisons, cohort 1 denotes HAZ and LAZ exposed to the mirror for 1h and displaying similar aggression levels, whereas cohort 2 denotes the comparison between the most aggressive HAZ during prolonged mirror exposure and the least aggressive LAZ. Source data and individual data values are available in Additional file 2

Acknowledgments
This image is the copyrighted work of the attributed author or publisher, and ZFIN has permission only to display this image to its users. Additional permissions should be obtained from the applicable author or publisher of the image. Full text @ BMC Biol.