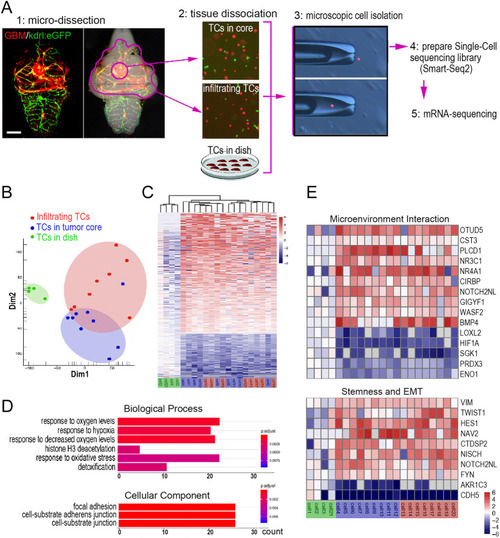
Single-cell RNA-sequencing (scRNA-seq) reveals the adaptive changes in the transcriptome of GBM xenografts in the zebrafish brain. (A) Schematic showing the strategy for isolating single GBM-U-251MG-mCherry cells by micromanipulation and preparation of a scRNA-seq library basing on Smart-Seq2 protocol. Scale bar: 100 µm. (B) Principal component analysis (PCA), based on the most variable genes of 21 GBM-U-251MG-mCherry cells, showing distinct patterns of cell clustering. (C) Unsupervised hierarchical cluster analysis, based on all significant differentially expressed genes, showing the similarity of transcriptomes. (D) Gene ontology (GO) pathway enrichment analysis, based on the dysregulated differentially expressed genes between the in vitro cultured GBM-U-251MG-mCherry cells and those isolated from xenografts. Count, number of genes related to the enriched GO. The color of the bars denotes the P-value. (E) Heatmap based on the differentially expressed genes of cells from xenografts versus in vitro cultured cells. TC, tumor cell.
|
