FIGURE SUMMARY
Title

Clinically relevant orthotopic xenograft models of patient-derived glioblastoma in zebrafish

Authors
Ai, X., Ye, Z., Xiao, C., Zhong, J., Lancman, J.J., Chen, X., Pan, X., Yang, Y., Zhou, L., Wang, X., Shi, H., Zhang, D., Yao, Y., Cao, D., Zhao, C.
Source
Full text @ Dis. Model. Mech.

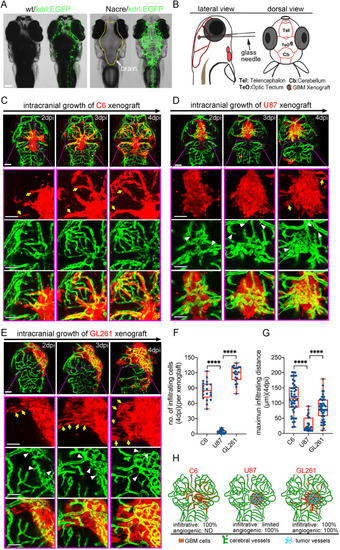
Zebrafish orthotopic xenografts reveal the specific in vivo histopathological features of implanted glioblastoma (GBM) tumor cell lines. (A) Fluorescence stereomicroscopy of Nacre/kdrl:EGFP zebrafish larvae, showing the clear brain vasculature. (B) Strategy of intracranial implantation of glioma cells into zebrafish larvae. (C) Live tracking of rat C6 xenografts shows extremely infiltrative growing pattern (yellow arrows) associating with rare angiogenesis. (D) Live tracking of human U87MG xenografts shows limited intracranial infiltration, but efficient tumor angiogenesis (white arrowheads). (E) Live tracking of mouse GL261 xenografts shows extremely infiltrative growing pattern (yellow arrows) associating with intensive angiogenesis (white arrowheads). (F,G) Box and whisker plots showing the number of infiltrating cells (per xenograft) (F) and maximum infiltrating distance (G) of each identified invading cell from the xenograft edge at 4 days postinjection (dpi). Median (minimum and maximum) values are 85.5 (49-111), 3 (0-12) and 122 (79-139) in F, and 115.5 (21-201), 18 (8-89) and 79 (10-179) in G, for C6, U87MG and GL261, respectively. n=6-9 brains were counted for each tested GBM xenograft. (H) Graph showing the progressing patterns of individual GBM xenografts in the zebrafish brains. Scale bars: 100 µm.

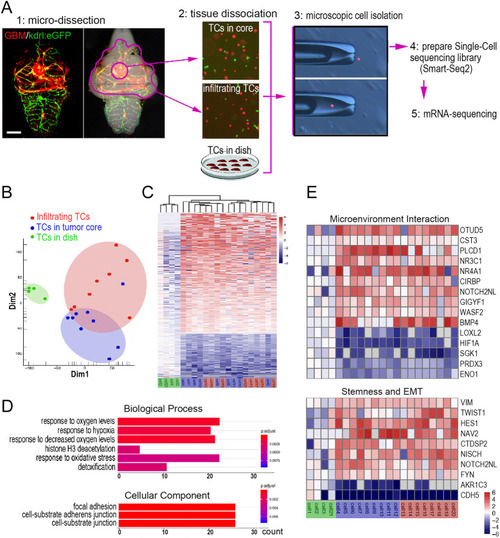
Single-cell RNA-sequencing (scRNA-seq) reveals the adaptive changes in the transcriptome of GBM xenografts in the zebrafish brain. (A) Schematic showing the strategy for isolating single GBM-U-251MG-mCherry cells by micromanipulation and preparation of a scRNA-seq library basing on Smart-Seq2 protocol. Scale bar: 100 µm. (B) Principal component analysis (PCA), based on the most variable genes of 21 GBM-U-251MG-mCherry cells, showing distinct patterns of cell clustering. (C) Unsupervised hierarchical cluster analysis, based on all significant differentially expressed genes, showing the similarity of transcriptomes. (D) Gene ontology (GO) pathway enrichment analysis, based on the dysregulated differentially expressed genes between the in vitro cultured GBM-U-251MG-mCherry cells and those isolated from xenografts. Count, number of genes related to the enriched GO. The color of the bars denotes the P-value. (E) Heatmap based on the differentially expressed genes of cells from xenografts versus in vitro cultured cells. TC, tumor cell.

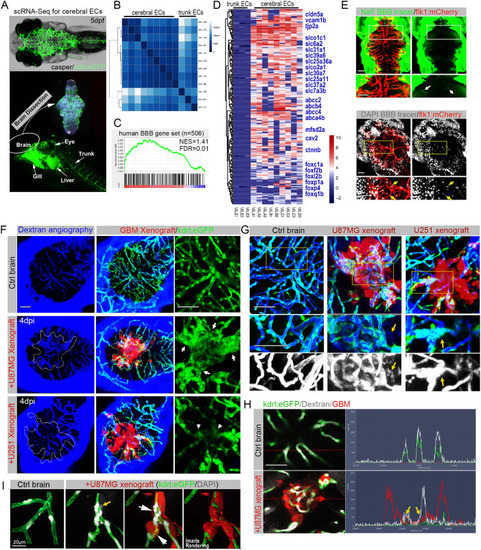
The zebrafish GBM xenograft provides a visual readout for the structural and functional changes of the tumor-associated blood–brain barrier (BBB). (A) Schematic showing the strategy of separating cerebral endothelial cells (ECs) from the trunk ECs of zebrafish larvae. (B) Unsupervised clustering analysis based on all significant differentially expressed genes of 12 ECs. (C) Gene set enrichment analysis (GSEA) showing the enrichment of BBB genes in zebrafish cerebral ECs. The BBB gene set contains 506 genes, including tight junction-related genes, solute carrier transporters and ATP-binding cassette transporters. (D) Heatmap showing the enriched BBB genes in zebrafish cerebral ECs compared with the trunk ECs. The bar is log2 scaled. (E) Live fluorescence microscopy of 5 days postfertilization (dpf) zebrafish heads, showing the incapability of small-molecule tracers NaF (376 Da) and DAPI (350 Da) to penetrate the brain parenchyma. Arrows indicate the BBB tracers that are restricted to cerebral capillaries. Areas in the dotted line boxes are magnified below. (F) Fluorescence microscopy of zebrafish cerebral angiography using Dextran Blue (10,000 Da), showing the intensive angiogenesis (arrows) in U87MG xenograft and vascular degeneration (arrowheads) in U-251MG xenograft. Dotted lines indicate the margin of xenografts. (G) High-resolution confocal images of cerebral angiography using Dextran Blue, showing the leakiness (yellow arrows) of tumor vessels in GBM xenografts. Areas in dotted line boxes are magnified below. (H) Fluorescence spectrums of blood vessels with Dextran Blue (white signaling) in control brain or GBM xenograft, showing expansion of Dextran Blue signaling (yellow arrows) beyond the vessel boundaries (green signaling) within the xenografts (red signaling). (I) High-resolution confocal images of DAPI staining, showing the limited leakage of DAPI (yellow arrow) from blood vessels with infiltrating tumor cells (white arrows). Scale bars: 100 µm (E-H), 20 μm (I).

Zebrafish GBM xenografts enable identification of BBB-penetrating drugs with in vivo activity on the tested GBM. (A) Schematic showing the small-molecule chemical delivery path into the zebrafish brain (5 dpf) from culturing water. NaF (10 μM) was added directly to fish water 2 h before imaging. Within the brain, NaF was restricted to cerebral vessels (arrows), but not freely diffusing in the parenchyma. (B) Schematic showing the strategy of grouping and drug treatment using the zebrafish GBM xenografts (U87MG). (C) Graph showing the growth inhibition of U87MG in vitro after 3 days’ treatment by various drugs at different concentrations. Cell number was tested by MTT assay, and the concentrations further tested in vivo were marked. (D) Box and whisker plot showing the xenograft size in each group after the drug treatment, showing significant inhibition by TMZ and RAPA. Median (minimum and maximum) values are 0.8725 (0.67-1.1), 0.43 (0.29-0.95), 0.91 (0.719-1.36), 0.8765 (0.415-1.465), 1 (0.532-1.365), 1.032 (0.385-1.045), 0.865 (0.618-1.308), 0.945 (0.413-1.083), 1.247 (0.639-1.298), 0.624 (0.2116-0.731) and 0.816 (0.531-1.381) for control, TMZ 500 μM, control, VIN 10 nM, VIN 20 nM, DOX 1 μM, DOX 2 μM, control, DEC 10 μM, RAPA 25 μM and GEM 20 μM, respectively. (E) Representative images of intracranial xenografts (U87MG) after drug treatment. The numbers of evaluated samples are indicated. Scale bars: 50 µm. Ctrl, control; RAPA, rapamycin; TMZ, temozolomide; VIN, vincristine.

Orthotopic engraftment of patient-derived GBM cells into the zebrafish brain. (A) Left: schematic showing the acquisition of primary GBM cells from patients. Middle: bright-field and fluorescent microscopy of in vitro cultured primary GBM cells (passage 1) from the same patient as 3D organoid, neurosphere and attached single-layer cells. Immunofluorescence staining showing NES and GFAP expression in differently cultured primary GBM cells. Right: fluorescence microscopy of 4 dpi GBM xenografts from primary GBM cells (passage 1). Primary GBM cells were labeled with CFSE before injecting into zebrafish brain. Two patients (GBM#109 Grade IV and GBM#24 Grade IV) were tested. (B,C) Fluorescence microscopy of 4 dpi patient-derived GBM xenografts from GBM patients (GBM#109, B; GBM#24, C), showing the heterogeneous phenotypes (infiltrative or demarcated) of primary GBM xenografts. Top: #GBM109 was defined as highly infiltrative and #GMB24 was defined as less infiltrative by MRI. Pink labeling (pink arrows) in MRI images indicates the edema zone and potential infiltrating areas. Bottom: brain vasculature is highlighted by fake gray color (kdrl:eGFP). Xenografts with more than five individual infiltrating cell clusters (white arrow) were defined as infiltrative, otherwise they were defined as demarcated. The numbers of xenografts with different phenotypes were counted (pie charts). Scale bars: 100 µm.

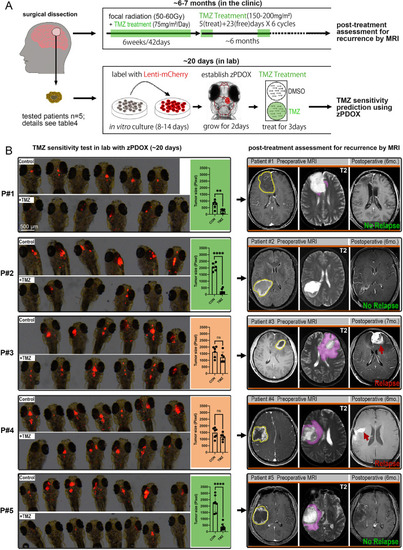
Short-term TMZ response in zebrafish patient-derived orthotopic xenografts (zPDOXs) predicts the tumor relapse in GBM patients treated with TMZ. (A) Schematic showing the procedure of clinical treatment of individual GBM patients and the parallel zPDOX operation in the laboratory. Right, top: after surgical dissection of the primary GBM tissue, the patient was subjected to standard radiotherapy and TMZ chemotherapy. Right, bottom: dissected GBM tissue was sent to the laboratory for establishment of the zPDOX and TMZ sensitivity test. (B) Comparison of short-term TMZ response in zPDOX in terms of tumor size inhibition ratio and the effect of TMZ on the corresponding patient in terms of tumor relapse (6-7 months later). Zebrafish recipients with zPDOX were imaged by a fluorescence stereomicroscope, and each xenograft was then scanned by a confocal microscope and measured by ImageJ. Graphs show the inhibition ratio of xenografts in terms of tumor size after 3 days' TMZ treatment. ns, not significant; **P<0.01, ****P<0.0001 (unpaired two-tailed Student's t-test). All five GBM patients were examined before surgery (Preoperative MRI) and ∼6-7 months after surgery (Postoperative) by MRI. Dotted line circles, gadolinium-enhanced tumor; pink labeling/arrows, vasogenic edema. Red arrows indicate tumor relapse. Scale bars: 500 µm.

Acknowledgments
This image is the copyrighted work of the attributed author or publisher, and ZFIN has permission only to display this image to its users. Additional permissions should be obtained from the applicable author or publisher of the image. Full text @ Dis. Model. Mech.