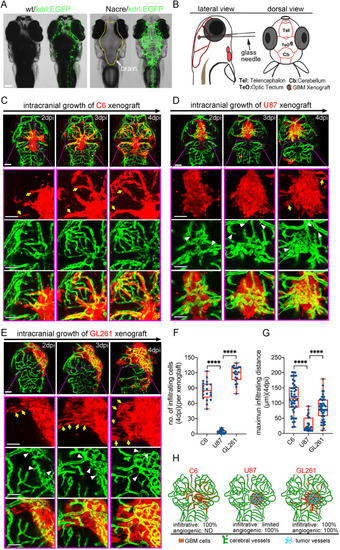
Zebrafish orthotopic xenografts reveal the specific in vivo histopathological features of implanted glioblastoma (GBM) tumor cell lines. (A) Fluorescence stereomicroscopy of Nacre/kdrl:EGFP zebrafish larvae, showing the clear brain vasculature. (B) Strategy of intracranial implantation of glioma cells into zebrafish larvae. (C) Live tracking of rat C6 xenografts shows extremely infiltrative growing pattern (yellow arrows) associating with rare angiogenesis. (D) Live tracking of human U87MG xenografts shows limited intracranial infiltration, but efficient tumor angiogenesis (white arrowheads). (E) Live tracking of mouse GL261 xenografts shows extremely infiltrative growing pattern (yellow arrows) associating with intensive angiogenesis (white arrowheads). (F,G) Box and whisker plots showing the number of infiltrating cells (per xenograft) (F) and maximum infiltrating distance (G) of each identified invading cell from the xenograft edge at 4 days postinjection (dpi). Median (minimum and maximum) values are 85.5 (49-111), 3 (0-12) and 122 (79-139) in F, and 115.5 (21-201), 18 (8-89) and 79 (10-179) in G, for C6, U87MG and GL261, respectively. n=6-9 brains were counted for each tested GBM xenograft. (H) Graph showing the progressing patterns of individual GBM xenografts in the zebrafish brains. Scale bars: 100 µm.
|
