
FIGURE
Fig. 7
Fig. 7
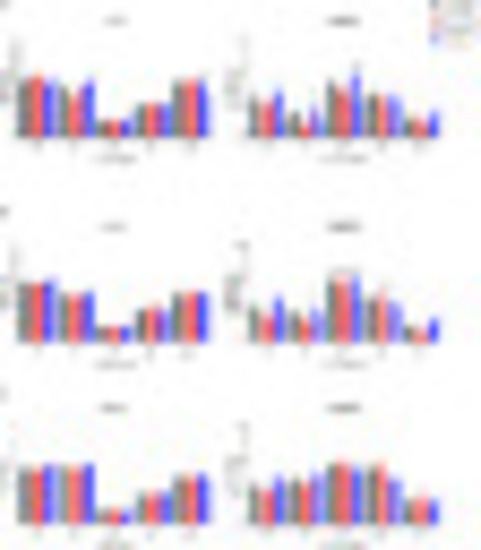
Fig. 7. Detailed analysis of AEP waveform in response to a 146 dB stimulus. Reaction velocity (latency) was evaluated in terms of the time of peak onset. The amplitude of the reaction peak was used to evaluate the scale of the reaction. A) 200 Hz-treated fish, B) 1 kHz-treated fish, and C) fish treated with white noise. Although the 200 Hz-treated group showed delayed reaction in frequency measurement, there was no change in the reaction velocity in general, with no frequency specificity. |
Expression Data
Expression Detail
Antibody Labeling
Phenotype Data
Phenotype Detail
Acknowledgments
This image is the copyrighted work of the attributed author or publisher, and
ZFIN has permission only to display this image to its users.
Additional permissions should be obtained from the applicable author or publisher of the image.
Reprinted from Hearing Research, 418, Han, E., Lee, D.H., Park, S., Rah, Y.C., Park, H.C., Choi, J.W., Choi, J., Noise-induced hearing loss in zebrafish model: Characterization of tonotopy and sex-based differences, 108485, Copyright (2022) with permission from Elsevier. Full text @ Hear. Res.