
Fig. 6
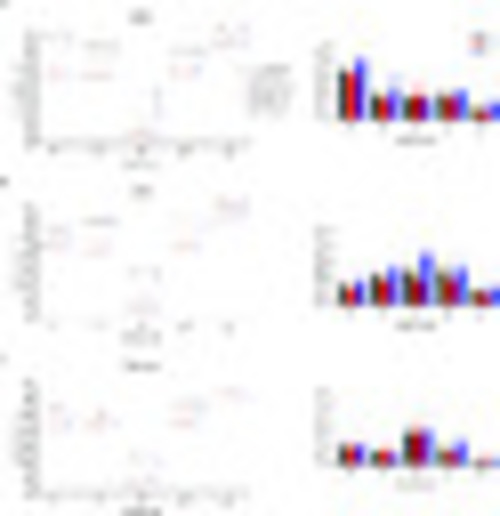
Fig. 6. Post-noise exposure changes in auditory threshold based on frequency. Left: mean threshold ± standard error of the mean. High-brightness symbols indicate the threshold before noise exposure and low-brightness symbols indicate the threshold after noise exposure. Right: pre- and post-treatment differences in the auditory threshold. Analyses of A) 200 Hz noise-treated fish, B) 1 kHz noise-treated fish, and C) fish treated with white noise showed that the auditory threshold increased regardless of sex. More threshold shifts were seen at the exposed frequencies. Furthermore, male zebrafish were more affected by noise and showed a wider variation in threshold shift than female zebrafish. n = 12 for each group. |
Reprinted from Hearing Research, 418, Han, E., Lee, D.H., Park, S., Rah, Y.C., Park, H.C., Choi, J.W., Choi, J., Noise-induced hearing loss in zebrafish model: Characterization of tonotopy and sex-based differences, 108485, Copyright (2022) with permission from Elsevier. Full text @ Hear. Res.