
Fig. 4.
- ID
- ZDB-FIG-220414-19
- Publication
- Takesono et al., 2022 - Estrogens regulate early embryonic development of the olfactory sensory system via estrogen-responsive glia
- Other Figures
- All Figure Page
- Back to All Figure Page
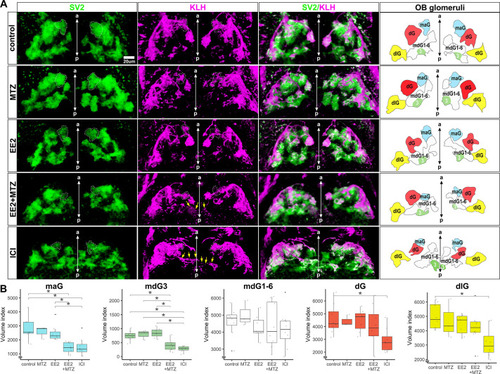
EROB cell ablation impairs the development of olfactory glomeruli. (A) Representative 3D images of olfactory glomeruli (SV2, green), OSNs (KLH, magenta) and merged image of SV2/KLM in control, MTZ, EE2, EE2+MTZ or ICI-exposed 4 dpf ERE:mCherry embryos. Right-end panels are the illustrations of OB glomeruli map generated based on the outlines and positions of five selected olfactory glomeruli in the representative 3D images: maG, blue; dG, red; dlG, yellow; mdG1-6, white; mdG3, green. The midlines are indicated with anterior-posterior (a-p) axis in the images. White dotted lines in SV2 and KLH images show maG; green coloured areas in OB glomeruli map show mdG3; yellow arrows in KLH images show altered axonal extensions of OSNs. (B) Relative volumes of the five different selected glomeruli. n=8 for control, EE2, EE2+MTZ and ICI, n=3 for MTZ alone. Data are mean±s.e.m. shown. *P<0.05 (ANOVA with Tukey post-hoc test). Boxplots show the median with 1st and 3rd quartiles of the distribution. Whiskers extend to the minimum and maximum of the data range within 1.5× the interquartile range; data beyond that range are defined as outliers and plotted individually in black. Overlaying the boxplot is a scatterplot in semi-transparent showing all individual observations. |