
- Title
-
Estrogens regulate early embryonic development of the olfactory sensory system via estrogen-responsive glia
- Authors
- Takesono, A., Schirrmacher, P., Scott, A., Green, J.M., Lee, O., Winter, M.J., Kudoh, T., Tyler, C.R.
- Source
- Full text @ Development
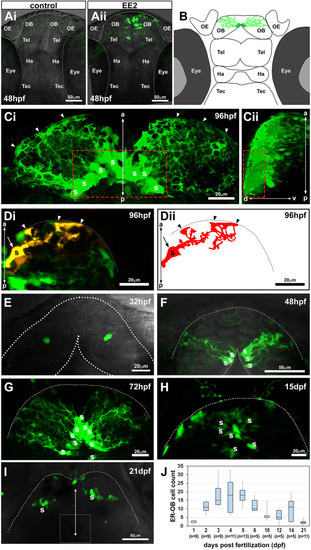
The earliest estrogens/ER-mediated transcriptional activation occurs in a small number of cells in the OB in the zebrafish embryonic brain. (Ai,Aii) Confocal z-projection images of control (Ai) or 17-α ethinylestradiol (EE2, 100 ng/l; Aii)-exposed zebrafish ERE:GFP embryos at 48 hpf. (B) Illustration of the EROB cellular domain in a 4 dpf zebrafish embryo. (Ci,Cii) Confocal z-projection images (Ci, dorsal view; Cii, a 90° rotated view) of EROB cells in EE2-exposed ERE:GFP embryos at 96 hpf. Red dotted rectangles outline the mediodorsal OB; arrowheads show the distal ends of EROB cells. (Di,Dii) Di shows the morphology of a single EROB cell from a confocal z-projection image and Dii illustrates a trace of the cell morphology. The midline is on the left edge; dotted lines show the OB pia; arrowheads show the termini of EROB cells at the OB pia; arrow shows the somata of the EROB cell. (E-I) Confocal z-projection images of EROB cells (green) showing their ontological development in the brain of embryo/larval zebrafish (dorsal view). Each animal stage was exposed to 100 ng EE2/l for up to 4 days before the indicated developmental stage. Dotted lines show the OB pia; white dotted square in I shows the mediodorsal OB. (J) Ontogenic profiles of EROB cell numbers. Boxplot shows median values (middle black bars) and 1st-3rd interquartile ranges (boxes); whiskers extend to the minimum and maximum of the data range within 1.5× the interquartile range. a-p, anterior-posterior axis; d-v, dorso-ventral axis; OB, olfactory bulb; OE, olfactory epithelia; Ha, habenula; S, somata; Tec, tectum; Tel, telencephalon. |
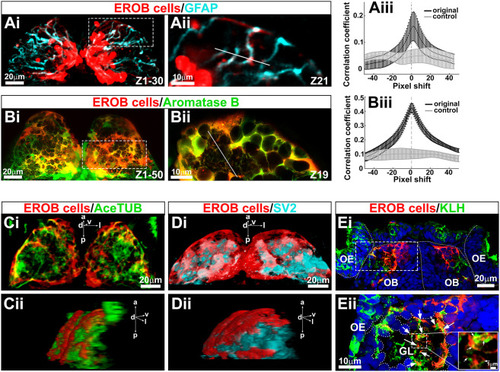
EROB cells are GFAP- and aromatase B-expressing glia that interact with olfactory sensory neurons at olfactory glomeruli. (Ai) Confocal z-projection images of EROB cells (mCherry, red) and GFAP (cyan) in an EE2-exposed 4 dpf ERE:mCherry embryo. (Aii) An optical section image (1.5 µm step size) magnified from the area marked with white dotted rectangle in Ai. (Aiii) Pearson's correlation coefficient in two dimensions for EROB cells versus GFAP, plotted against image displacement in the x-direction (black). Control corresponds to image sets with one channel rotated by 90° (light grey). The peak correlation coefficient (PCC) was found at a 1.5 pixel shift (0.22 µm/pixel size), suggesting a close localisation of EROB cell and GFAP in the same projection (data are mean±s.e.m.). (Bi) Confocal z-projection images of 4 dpf EE2-exposed double transgenic – Tg(ERE:mCherry)×Tg(cyp19a1b:GFP) – embryo. (Bii) One optical section image (0.7 µm step size) magnified from the area marked with white dotted rectangle in Bi. (Biii) Pearson's correlation coefficient in two dimensions for EROB cells versus aromatase B. The PCC was at 0 pixel shift, indicating co-localisation of EROB cell and aromatase B. *P<0.05 (t-test for significant difference from the rotated control image sets, grey). Data are mean±s.e.m. (n=3). (Ci,Cii) A 3D image of EROB cells (red) and acetylated tubulin-positive axonal projections (green) in the OB (Ci, dorsal view; Cii, a 50° rotated view of Ci). (Di,Dii) A 3D image of EROB cells (red) and olfactory glomeruli stained with SV2 antibody (cyan) (Di, dorsal view; Dii, a 45° rotated view of Di). (Ei) Frontal cryosection image of EROB cells (red), OSNs (KLH, green) and nuclei (Hoechst, blue). White dotted lines indicate the outline of the olfactory epithelia (OE), olfactory bulb (OB) and midline. (Eii) A magnified image of a glomerulus (GL) from the area indicated with a white dotted rectangle in Ei. Arrows indicate EROB cell–KLH+ OSN interactions. Outline of the GL is indicated with white dotted freeform line. Magnified image of a central area of the GL is inserted on the right, showing that EROB cells (red) tightly intermingle with OSNs (green) within the GL (indicated with white arrows). a, anterior; d, dorsal; l, lateral; p, posterior; v, ventral. |
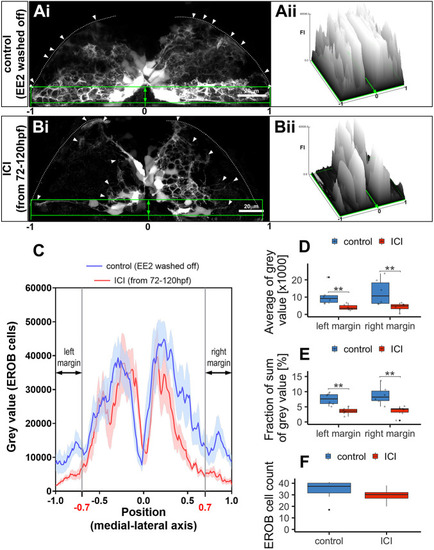
Estrogens regulate EROB cell projections. (Ai,Bi) Confocal z-projection image of EROB cells in EE2-exposed (from 1 hpf to 72 hpf, then washed off) control (Ai) or subsequently an ER antagonist, ICI 182,780 (ICI, 10 µM)-treated (from 72 hpf to 120 hpf) (Bi) 5 dpf ERE:GFP embryo (see details in Materials and Methods). Arrowheads show the distal end of the EROB cells; white dotted line indicates the pia of the OB; green rectangles highlight EROB cell margins. (Aii,Bii) Surface plots of fluorescence intensity (FI) of GFP signals (EROB cells) in the EROB cell margins in control (Ai) and ICI-treated (Bi) embryos. The surface plots are shown along the width of the EROB cell margin, adjusted by the position of the midline as ‘0’ and the positions of lateral ends as ‘−1 (left)’ or ‘1 (right)’. (C) The intensity plots of GFP signals (EROB cells) in the EROB cell margin in control (blue) and ICI (red) embryos. X-axis is adjusted as described above. Data are mean±s.e.m., n=6 each. Black double arrows indicate both edges of the EROB cell margin, at the positions of [−1:−0.7] (left margin) and [0.7:1] (right margin). (D,E) The average of grey value and sum of grey value (percentage of total grey value in each embryo) of left and right margin (n=6 each). **P<0.01 (Mann–Whitney U-test). (F) The total EROB cell count (n=8, P=0.19, t-test). Boxplots show the median (middle black bar) with 1st and 3rd quartiles of the distribution. Whiskers extend to the minimum and maximum of the data range within 1.5× the interquartile range; data beyond that range are defined as outliers and plotted individually in black. Overlaying the boxplot is a scatterplot in semi-transparent showing all individual observations. |
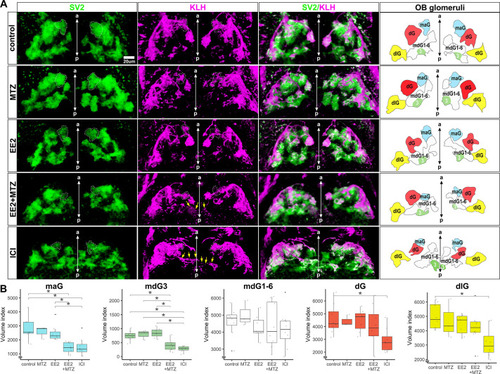
EROB cell ablation impairs the development of olfactory glomeruli. (A) Representative 3D images of olfactory glomeruli (SV2, green), OSNs (KLH, magenta) and merged image of SV2/KLM in control, MTZ, EE2, EE2+MTZ or ICI-exposed 4 dpf ERE:mCherry embryos. Right-end panels are the illustrations of OB glomeruli map generated based on the outlines and positions of five selected olfactory glomeruli in the representative 3D images: maG, blue; dG, red; dlG, yellow; mdG1-6, white; mdG3, green. The midlines are indicated with anterior-posterior (a-p) axis in the images. White dotted lines in SV2 and KLH images show maG; green coloured areas in OB glomeruli map show mdG3; yellow arrows in KLH images show altered axonal extensions of OSNs. (B) Relative volumes of the five different selected glomeruli. n=8 for control, EE2, EE2+MTZ and ICI, n=3 for MTZ alone. Data are mean±s.e.m. shown. *P<0.05 (ANOVA with Tukey post-hoc test). Boxplots show the median with 1st and 3rd quartiles of the distribution. Whiskers extend to the minimum and maximum of the data range within 1.5× the interquartile range; data beyond that range are defined as outliers and plotted individually in black. Overlaying the boxplot is a scatterplot in semi-transparent showing all individual observations. |
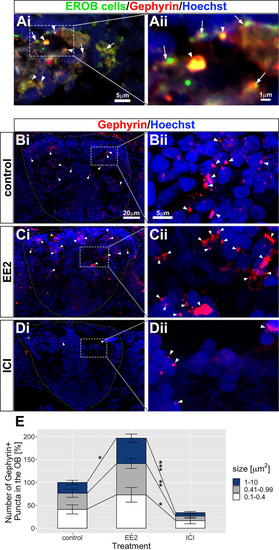
Estrogens promote inhibitory synaptogenesis in the OB. (Ai,Aii) A transverse cryosection image of EROB cells (green), gephyrin puncta (red) and nuclei (blue) in EE2-exposed 4 dpf ERE:GFP embryos. The distal-ends of EROB cell projections co-localise with (arrowheads) or localise in close proximity to (arrows) gephyrin+ inhibitory synapses at an olfactory glomerulus. Aii shows a magnified image of a sub-region of olfactory glomerulus in Ai. (Bi-Dii) Estrogens promote inhibitory synaptogenesis in the OB, whereas ICI inhibits the formation of inhibitory synapses. (Bi,Bii) control; (Ci,Cii) EE2-treated; (Di,Dii) ICI-treated 4 dpf ERE:GFP embryos. Gephyrin puncta (red) in the OB are shown with arrowheads. Bii, Cii and Dii show magnified images of a sub-region of the OB indicated in Bi, Ci and Di, respectively. (E) Percentage increase in the total numbers of gephyrin+ puncta in the OB. The number of gephyrin+ puncta was quantified for three different sizes, 0.1-0.4 µm2 (white), 0.41-0.99 µm2 (grey) and 1-10 µm2 (blue). Data are mean±s.e.m., n=4. *P<0.05, **P<0.01, ***P<0.001 (ANOVA with Tukey post-hoc test). |
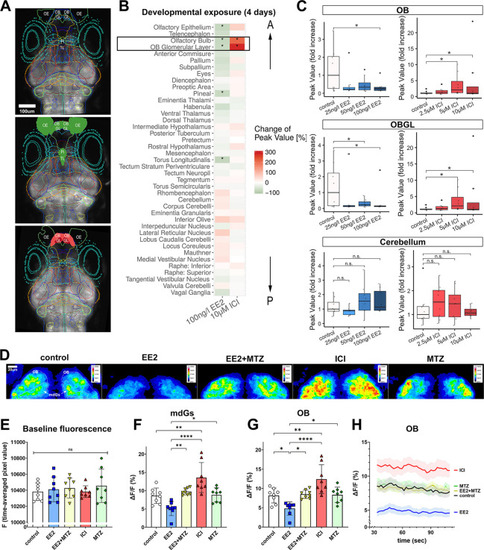
Estrogens/EROB cell cascade inhibits the intrinsic spontaneous neuronal activity in the OB. (A) LSM images of 4 dpf elavl3:GCaMP6s zebrafish embryo brain (dorsal view) of control (top), EE2-exposed (middle) and ICI-exposed embryos (bottom). Each coloured line represents a brain ROI. ROIs for which GCaMP activity is inhibited by EE2 are coloured with green and those activated by ICI are coloured with red (based on the data in Fig. 6B). (B) Heat map displaying changes (%) of GCaMP signals in 41 different brain regions. A black rectangle indicates the most affected ROIs (OB and OBGL). The order of ROIs represents the location of a ROI along anterior-posterior (A-P) axis (top-bottom). *P<0.05 (likelihood ratio test with Tukey's post-hoc test), n=8 each. (C) Dose-dependent effects of EE2 and ICI on intrinsic neuronal activity. *P<0.05 (likelihood ratio test with Tukey's post-hoc), n=8 each. Boxplots show the median with 1st and 3rd quartiles of the distribution. Whiskers extend to the minimum and maximum of the data range within 1.5× the interquartile range; data beyond that range are defined as outliers and plotted individually in black. Overlaying the boxplot is a scatterplot in semi-transparent showing all individual observations. (D) Representative confocal z-projection images of time-averaged GCaMP6s signals in the OB of control, EE2-, ICI-, MTZ- and EE2+MTZ-exposed 4 dpf Tg(ERE:mCherry)×Tg(elavl3:GCaMP6s) embryos. Representative ROIs of left and right mdG1-6 (mdGs) and ROIs of left and right OB are marked with white lines in the control image. (E) Raw baseline fluorescence signal (F) (time-averaged pixel value) of experimental groups. (F,G) Time-averaged intrinsic neuronal activity in mdGs (F) and in OB (G) from each experimental group (n=7-9) are shown as ΔF/F (%). *P≤0.05, **P≤0.01, ****P≤0.0001 (ANOVA with Tukey post-hoc test). (H) Time-course of the intrinsic neuronal activity in the OB. n.s., not significant; OB, olfactory bulb; OBGL, olfactory bulb glomerular layer; OE, olfactory epithelia; Pi, pineal; TL, torus longitudinalis. |
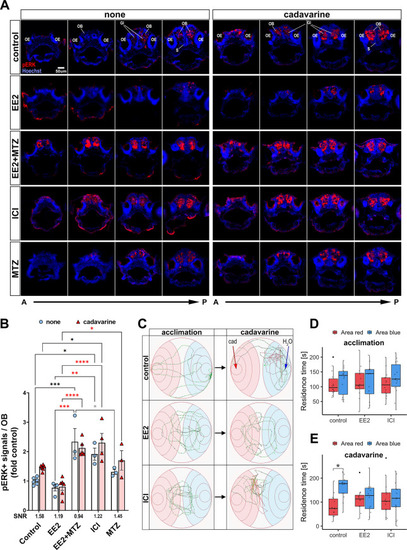
Estrogens inhibit olfaction-evoked neuronal activation and abolish olfaction-mediated avoidance behaviour. (A) Representative sequential forebrain transverse section images of pERK- (red) and nuclei (blue)-stained none (left) and cadavarine-stimulated (right) control, EE2-, EE2+MTZ-, ICI- or MTZ-treated 5 dpf ERE:mCherry larvae. (B) pERK signals within ∼50 µm A-P volume of the OB of none (white bar/pale blue dots) or cadavarine-stimulated (red bar/red triangles) 5 dpf ERE:GFP larvae (n=3-6) are shown. *P≤0.05, **P≤0.01, ***P≤0.001, ****P≤0.0001 (ANOVA with Tukey post-hoc test). Black, red and grey asterisks show comparisons with control, EE2 and EE2+MTZ, respectively. Signal/noise ratio (SNR) was calculated as ‘the mean of the odour-evoked pERK levels/the mean of the basal pERK levels’ (shown below the x-axis). (C) Representative swimming trajectories of control (top row), EE2- (middle row) and ICI-(bottom row) exposed 9-11 dpf ERE:mCherry larvae. Trajectories (5 min) during acclimation (left column) and after cadavarine administration (right column) from the same larva are shown. The administration sites of either cadavarine (red arrow) or water (blue arrow) are indicated in control/cadavarine-stimulated trajectory (top/right). (D,E) Averaged residence time in red (cadavarine) or blue (water) area during acclimation (D) and after cadavarine administration (E) in control (n=14), EE2- (n=12) or ICI- (n=12) treated larvae. *P<0.05 (likelihood ratio test with Tukey's post-hoc test). Boxplots show the median with 1st and 3rd quartiles of the distribution. Whiskers extend to the minimum and maximum of the data range within 1.5× the interquartile range; data beyond that range are defined as outliers and plotted individually in black. Overlaying the boxplot is a scatterplot in semi-transparent showing all individual observations. A-P, anterior-posterior axis; Gl, olfactory bulb glomerular layer; OB, olfactory bulb; OE, olfactory epithelia; S, subpallium. |