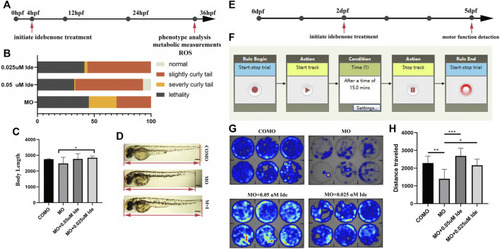
(A) Design of the short-term phenotype assay in zebrafish. MO-tcap was injected into one-four cell stage embryos. Drug treatments were applied from 4 hpf. At 36 hpf, the phenotype was analyzed. (B) Graphic summary of the percentage of normal, slightly curly tail, severely curly tail, and lethality in different classes of LGMD2G zebrafish with or without idebenone treatment. (C) Body length analysis of different groups. One-way ANOVA (Dunnett’s post hoc test) was used to compare the MO, MO + 0.05 μM Ide, MO+0.025 μM groups. (D) Idebenone restored the body length of LGMD2G zebrafish. M + I, MO + idebenone. (E) Design of the short-term swimming activity assay in zebrafish: pairs of wild-type zebrafish were mated, and COMO and MO were injected into 1-4 cell stage embryos. Drug treatments were applied to the progeny in six-well plates (1 embryo per well) beginning at 2 dpf. At 5 dpf, a swimming activity assay was performed. (F) The locomotor activity settings for one cycle (15 min) of tracking are shown. (G) Representative heatmaps of swimming activity produced by DanioVision comparing COMO-injected, MO-injected, and MO-injected drug-treated fish over 15 min. Heatmap showing the tracking path of six zebrafish from each experimental group. The blue marks indicate the area the zebrafish passed through, and the depth of color represents the cumulative frequency of the tracking path. (H) Distance traveled by zebrafish from four different groups (COMO, MO, MO + 0.05 μM Ide, and MO + 0.025 μM Ide). One-way ANOVA (Dunnett’s post hoc test) was used for comparisons among the MO, MO+0.05 μM Ide, and MO+0.025 μM groups. An unpaired t test was used to compare the MO and COMO groups. p < 0.05 (*), 0.001 < p < 0.05 (**), p < 0.001 (***).
|
