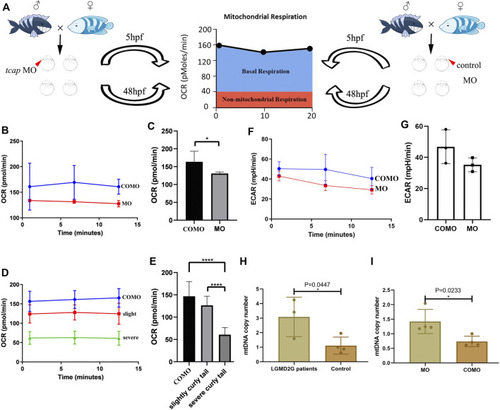
(A) Cartoon representation of how the Seahorse bioanalyzer displays mitochondrial bioenergetics. (B,C) OCR of control subjects (three zebrafish larvae in each group, four groups in total) and tcap knockdown zebrafish (four groups) at 5 hpf. The OCR of control subjects was significantly higher than that of tcap knockdown models of LGMD2G. An unpaired t test was used to compare the MO and COMO groups. * Indicates p < 0.05. (D,E) Comparison of OCR among control subjects (n = 4), tcap knockdown zebrafish with the slight phenotype (n = 4), and tcap knockdown zebrafish with the severe phenotype (n = 4). The OCR of control subjects was significantly higher than that of slightly curly tailed or severe curly tailed MO-tcap zebrafish. One-way ANOVA (Dunnett’s post hoc test) was used to compare the COMO, slightly curly tail, and severe curly tail groups; ****indicates p < 0.001. (F,G) ECR of control subjects (three zebrafish larvae in each group, four groups in total) and tcap knockdown zebrafish (four groups) at 5 hpf. The ECAR of control subjects was not significantly higher than that of tcap knockdown models of LGMD2G. An unpaired t test was used to compare the MO and COMO groups. (H,I) MtDNA copy number in patients with LGMD2G and control subjects (H) and tcap knockdown zebrafish and control zebrafish (I). Unpaired t test was used for comparisons. * Indicates p < 0.05.
|
