
FIGURE
FIGURE 4
- ID
- ZDB-FIG-220406-35
- Publication
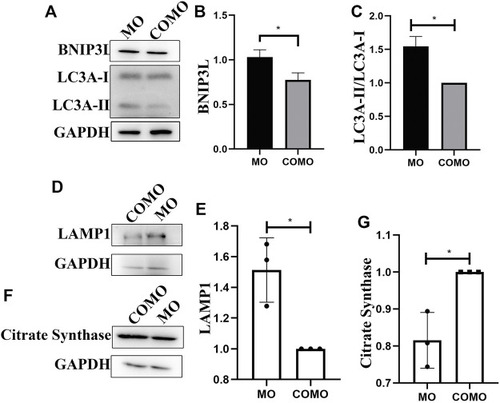
- Lv et al., 2022 - Tcap Deficiency in Zebrafish Leads to ROS Production and Mitophagy, and Idebenone Improves its Phenotypes
- Other Figures
- All Figure Page
- Back to All Figure Page
FIGURE 4
|
Expression Data
| Antibodies: | |
|---|---|
| Fish: | |
| Knockdown Reagent: | |
| Anatomical Term: | |
| Stage: | Long-pec |
Expression Detail
Antibody Labeling
Phenotype Data
| Fish: | |
|---|---|
| Knockdown Reagent: | |
| Observed In: | |
| Stage: | Long-pec |
Phenotype Detail
Acknowledgments
This image is the copyrighted work of the attributed author or publisher, and
ZFIN has permission only to display this image to its users.
Additional permissions should be obtained from the applicable author or publisher of the image.
Full text @ Front Cell Dev Biol