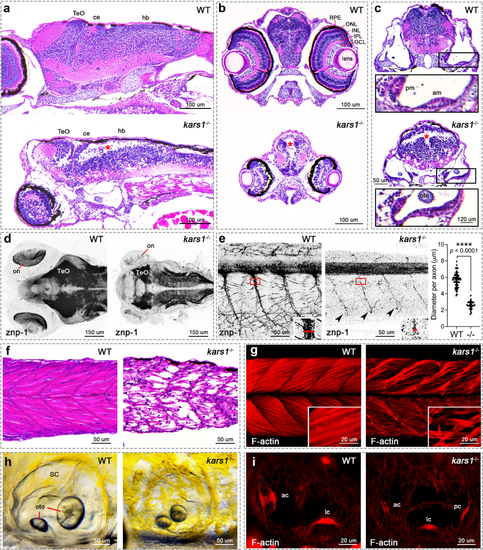
Fig. 3. The kars1−/− larvae display neurological, muscle, and inner ear defects by histological analysis at 5 dpf. (a) Head region of wild-type (WT) and kars1−/− mutant by sagittal section. Red asterisks indicate massive loss of cell density, as well as in (b) and (c). Anterior to the left and dorsal to the top. (b) Eye region of WT and kars1−/− mutant by cross-section. Dorsal to the top. (c) Inner ear region of WT and kars1−/− mutant by cross-section. Dorsal to the top. Lower panels were enlarged picture from black box. (d) Head region of WT and kars1−/− larvae immunostained with anti-znp-1 antibody. The black-and-white fluorescent signals were inverted to negative film for a clear presentation. Dorsal view, anterior to the left. on, optic nerve. (e) Trunk region of WT and kars1−/− larvae which were immunostained with anti-znp-1 antibody. ImageJ was used to measure the diameter of primary motor axons as indicated by red line in the right-down panels (enlarged from red box). Statistics are shown on the right-hand side. Black dot indicates the diameter of each motor axon. Error bars = mean ± SD. Two-tailed unpaired nonparametric Mann–Whitney test: ****p < 0.0001. Black arrowheads indicate the reduced terminal axonal branching compared to WT. Anterior to the left and dorsal to the top. (f) The trunk region of WT and kars1−/− larvae revealed by sagittal section. Anterior to the left and dorsal to the top. (g) The trunk region of WT and kars1−/− larvae revealed by confocal projections of phalloidin stained muscle fiber. Anterior to the left and dorsal to the top. The lower-right panels are the higher-magnification view. (h) Representative bright-field images of WT and kars1−/− inner ear. Anterior to the left and dorsal to the top. oto otolith, SC semicircular canal. (i) The red fluorescent conjugated phalloidin staining was performed to visualize the bundles (stereocilia) of hair cells in inner ear. Anterior to the left and dorsal to the top. ac anterior crista, am anterior macula, ce cerebellum, GCL ganglion cell layer, hb hindbrain, INL inner nuclear layer, IPL inner plexiform layer, lc lateral crista, ONL outer nuclear layer, pc posterior crista.pm posterior macula, RPE retinal pigment epithelium, TeO optic tectum.
|
