|
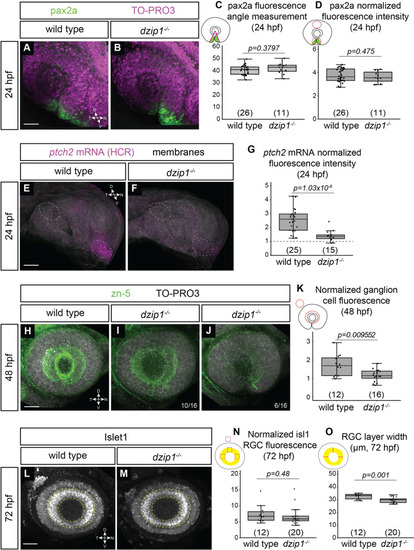
<italic toggle='yes'>dzip1</italic> mutants show defects in ganglion cell differentiation, which may be indicative of disrupted Hedgehog (Hh) signaling.(A-B) Whole mount immunofluorescence for pax2a (green), and nuclei (magenta, TO-PRO-3) in wild type (A) and dzip1ts294e mutants (B) at 24hpf. Images are lateral views of 3-dimensional renderings. (C) Quantification of the pax2a+ domain, and (D) Quantification of pax2a normalized fluorescence intensity at 24 hpf. Quantification was carried out as depicted in the schematics; for fluorescence quantification, measurements in the optic stalk and fissure were normalized to a region in the dorsal optic cup. (E-F) ptch2 mRNA expression (HCR, magenta) and membranes (gray) in wild type (E) and dzip1ts294e mutants (F) at 24 hpf. Images are maximum intensity projections of ptch2 mRNA channel (magenta) on an average projection of the membrane channel (gray) to visualize tissue morphology; embryos were oriented laterally. (G) Quantification of ptch2 mRNA fluorescence intensity. Fluorescence in the optic stalk region was normalized to a region in the dorsal optic cup (as depicted by dashed ellipses in E and F). (H-J) Whole mount immunofluorescence for retinal ganglion cells (green, zn-5) and nuclei (magenta, TO-PRO-3) in wild type (H) and different dzip1ts294e mutants (I, J) at 48 hpf. All images are lateral views of 3-dimensional renderings. Two classes of dzip1-/- phenotype were noted (I, J); fraction of dzip1-/- embryos showing each type of zn-5 labeling is shown at the bottom right of each panel. (K) Quantification of zn-5 fluorescence intensity at 48 hpf. Fluorescence intensity was measured in an elliptical ROI on a maximum intensity projection of the three-dimensional z-stack spanning the depth of the lens. Zn-5 fluorescence intensity in the eye was normalized to a region in the brain dorsal to the eye. (L-M) Whole mount immunofluorescence for islet1/2 (gray) in wild type (L) and dzip1ts294e mutants (M) at 72 hpf. Images are maximum intensity projections of laterally oriented embryos. Islet1 is expressed by retinal ganglion cells (layer marked by yellow dashed lines) and subsets of amacrine, bipolar, and horizontal cells. (N-O) Quantification of islet1/2 staining in RGCs, specifically for fluorescence intensity (N) and RGC layer width (O). Quantification method is depicted in each schematic. For islet1/2 RGC fluorescence, mean gray value was measured at nasal, dorsal, and temporal positions within the RGC layer, and the average of those values was normalized to the mean gray value at a position dorsal to (outside of) the eye. The width of the RGC layer was calculated by measuring the width of the RGC layer at nasal, dorsal, and temporal positions; these measurements were averaged for each embryo. For all graphs, n (embryos) for each genotype shown at the base of the graph. P-values were calculated using a student’s t-test (M-O). Scale bar: 50 μm. D, dorsal; V, ventral; N, nasal; T, temporal.
|