
Fig. 1
- ID
- ZDB-FIG-220307-15
- Publication
- Gao et al., 2022 - Pluripotency factors determine gene expression repertoire at zygotic genome activation
- Other Figures
- All Figure Page
- Back to All Figure Page
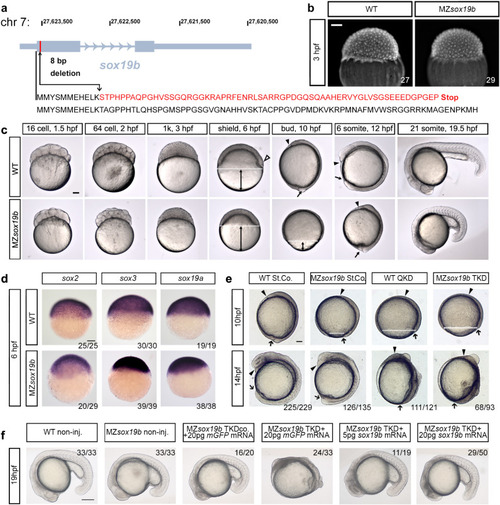
Redundant activity of SoxB1 family factors Sox19b, Sox19a, Sox2 and Sox3 is required at post-gastrulation developmental stages.
a Disruption of the sox19b gene on chromosome 7 by introducing an 8 bp deletion. b No difference in cell division rates between WT and MZsox19b was observed prior to MBT (see also Fig. S1). c MZsox19b embryos are delayed in gastrulation (see Fig. S2 for statistics). Simultaneously collected WT and MZsox19b embryos were let to develop at 28,5 °C, pictures of representative embryos were taken at the indicated time points/developmental stages of the wild type. In zebrafish embryos, embryonic shield forms at 6 hpf at the dorsal side during gastrulation (hollow arrowhead in the wild type). MZsox19b embryos are still phenotypically at 40% epiboly (blastula). Gastrulation ends with tail bud formation at 10 hpf. MZsox19b embryos are still at 80–90% epiboly gastrula stage. d In situ hybridization for sox2, sox3, and sox19a, in WT and MZsox19b embryos, lateral views. e Quadruple Sox19a/b, Sox2, and Sox3 knockdown embryos complete gastrulation, but show later defects in tail bud formation and axis elongation. 1-cell stage wild-type or MZsox19b embryos were injected with control morpholino (StCo), or QKD (quadruple knockdown) mix (Sox2, Sox3, Sox19a, and Sox19b morpholinos), or TKD (triple knockdown, Sox2, Sox3, Sox19a morpholinos), as indicated. f Axis elongation defects in MZsox19b-TKD are rescued by injection of sox19b mRNA. 1-cell stage MZsox19b embryos were injected with either TKD mix or TKDco mix (Sox2, Sox3, Sox19b morpholinos), together with Sox19b or control GFP mRNA, as indicated (see Fig. S3d–g for additional statistics). Double black arrows show the distance from epiboly border (white dotted line) to the vegetal pole. Black arrow—tail bud, black arrowhead—head process. Scale bar 200 µm. Scale bars in b–e: 100 µm, in f: 200 µm. |
| Genes: | |
|---|---|
| Fish: | |
| Anatomical Term: | |
| Stage: | Shield |
| Fish: | |
|---|---|
| Knockdown Reagents: | |
| Observed In: | |
| Stage Range: | 1k-cell to 20-25 somites |