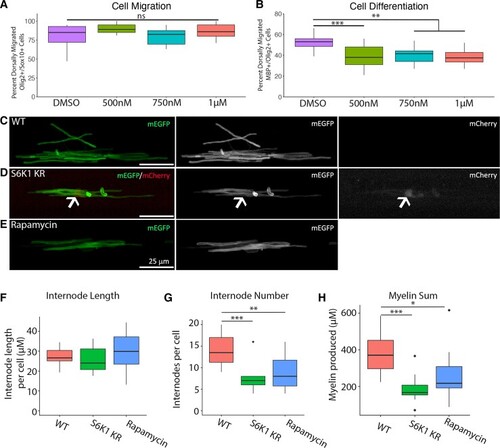
Inhibiting S6K1 kinase activity in oligodendrocytes decreases myelin production in vivo. (A) The per cent of dorsally migrated Olig2+ cells that were Olig2+/Sox10+ in the ventral spinal cord of zebrafish treated with p70S6K1 inhibitor PF-4708671 from 2 to 3 dpf. ANOVA F(3,33) = 1.971, ns, P = 0.1374. (B) The per cent of all Olig2+ dorsally migrated cells that were Mbp+/Olig2+ treated with p70S6K1 inhibitor PF-4708671 from 2 to 4 dpf. ANOVA F(3,51) = 7.275, P = 0.004, Dunnett's multiple comparisons test adjusted P-value **P = 0.0012–0.0032, ***P = 0.0006, n = 9–15 fish per treatment group. (C–E) Representative images of myelin internodes. Zebrafish embryos were injected with pMBP:mEGFP along with a second plasmid to manipulate S6K1 function, labelled with cytoplasmic RFP or treated with the mTOR inhibitor rapamycin from 2 to 4 dpf. All images were taken in the ventral spinal cord above the yolk sac extension. (C) WT cell expressing pMBP:mEGFP to label internodes. (D) A cell expressing both pMBP:mEGFP to label internodes and pMYRF:S6K1-KR to inhibit S6K1 function, labelled with red fluorescent protein (arrowhead). (E) pMBP:mEGFP+ cell in rapamycin-treated zebrafish. (F) Quantification of myelin internode length averaged per cell. Internode length: ANOVA, F(2,24) = 2.731, ns, P = 0.0854. (G) Quantification of myelin internode number averaged per cell. ANOVA, F(2,24) = 10.25, P = 0.0006; with Tukey's multiple comparisons test adjusted P-value: **P = 0.0024, ***P = 0.0009, (H) Sum of myelin produced per cell. ANOVA, F(2,24) = 8.259, P = 0.0019; with Tukey's multiple comparisons test adjusted P-value: *P = 0.0026, **P = 0.014. All images were analysed in 3D using IMARIS software. n = 10–14 cells per condition (one cell per fish). Scale bars (C–E), 25 µm.
|