
Fig. 3
In vivo calcium imaging across different optical configurations.
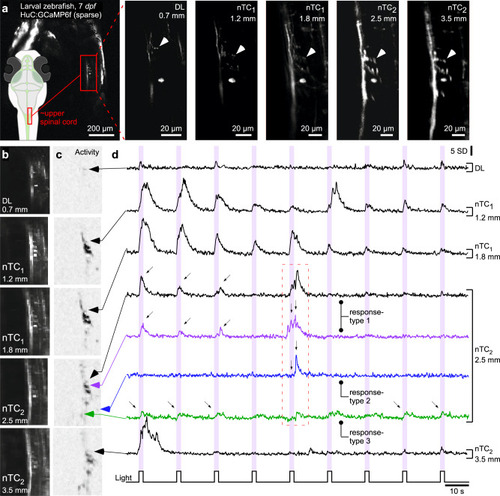
a The same set of neurons of the 7 dpf larval zebrafish upper spinal cord (HuC:GCaMP6f, random sparse expression, see overview scan and schematic on the left) was imaged in all optical configurations as indicated at 512 × 512 px (1 Hz). Arrowheads highlight the same synaptic structures in each scan. b–d 64 × 64 px (7.81 Hz) activity scan from fields of view shown in (a) for all five configurations during presentation of full-field flashes of UV-light which stochastic elicited activity in these imaged neural structures. In each case the average scan projection (b) and neighbour-correlation based activity projection (c) are shown (hereafter referred to as “activity-correlation”). Darker shadings, equalised for visibility, denotes increased local activity (for details, see ref. 70). Black traces in (d) show time-traces for the same structure in all cases. For the nTC2 2.5 mm FOV condition, time-traces from different neural structures are extracted to illustrate different responses in different structures. All activity traces in this and the following figures are shown in z-scores relative to their own baseline (hence y-scale in s.d.). We choose this metric over dF/F as it emphasises detectability of events rather than the relative change from the indicator’s baseline fluorescence, which differs between biosensors. |