
Fig. 9
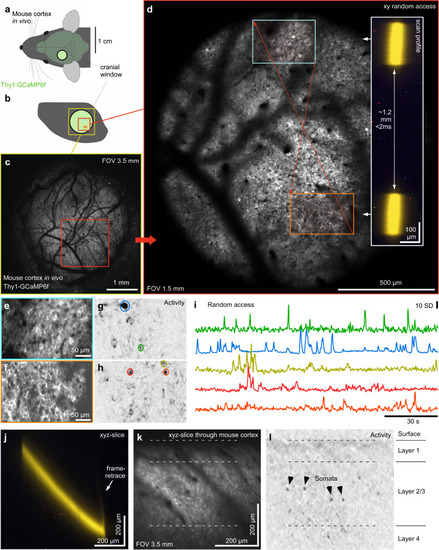
Mesoscale random-access imaging of mouse cortex in vivo.
a,b Schematic of Thy1:GCamP6f mouse brain in vivo (a) with cranial window over the somatosensory cortex (b). c, d 1024 × 1024 px nTC2 (c) and nTC1 (d) images as indicated. Red arrows indicate rapid transitions between scan regions, with the inset indicating the scan-profile. e–i 2 times 128 × 256 px (3.91 Hz) random access scan as indicated in (d) with mean-projection (e, f), activity-correlation (g, h, cf. Fig. 3c) and fluorescence traces (i), taken from the ROIs as indicated in (g, h). j–l nTC1 128 × 128 px xyz-tilted plane (7.82 Hz) traversing through cortical layers 1–4 at ~45° relative to vertical (such that the x-image dimension corresponds to the x-mirror, while the y-dimension in the image represents simultaneous and matched y- and z-movement, with mean image (k) and activity-correlation (i, cf. Fig. 3c). The scan was taken under nTC2 3.5 mm FOV configuration and zoomed in to the central ~0.6 mm. |