
Figure 7
- ID
- ZDB-FIG-220203-55
- Publication
- Zhu et al., 2021 - Nucleolar GTPase Bms1 displaces Ttf1 from RFB-sites to balance progression of rDNA transcription and replication
- Other Figures
- All Figure Page
- Back to All Figure Page
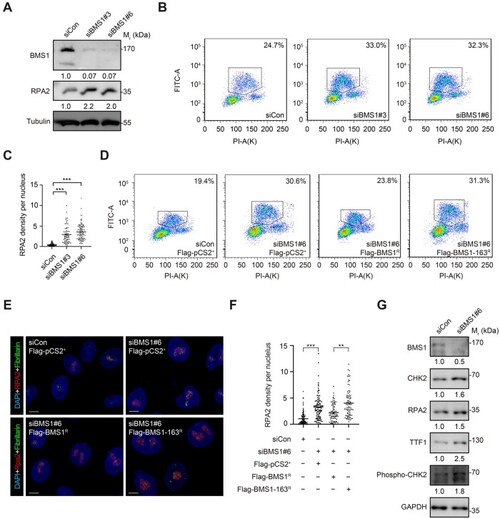
Knockdown of human BMS1 causes DNA over-replication and nucleolar accumulation of RPA2. (A) Western blotting of human BMS1 and RPA2 in HeLa cells showing that knockdown of BMS1 by siBMS1#3 and siBMS1#6 treatment obviously increases the level of RPA2 compared with siControl (siCon) treatment at 96 h. Tubulin: loading control. (B) Flow cytometry analysis of BrdU/PI double-labeled cells at 96 h after siRNA transfection showing that knockdown of human BMS1 arrests cells at the S-phase. Frame: ratio of cells at S-phase; PI-A, PI intensity; FITC-A, BrdU intensity. (C) Statistical analysis showing a nucleolar enrichment of RPA2 after siBMS1#3 and siBMS1#6 treatment. (D) Flow cytometry analysis of BrdU/PI double-labeled cells showing the rescue of the ratio of cells at the S-phase by Flag-BMS1R but not Flag-BMS1-163R in siBMS1#6-treated cells when compared with Flag-pCS2+. Frame: ratio of cells at S-phase. (E and F) Coimmunostaining of RPA2 and Fibrillarin (E) showing that the nucleolar enrichment of RPA2 after siBMS1#6 treatment is alleviated by Flag-BMS1R but not Flag-BMS1-163R (F). Scale bar, 5 μm. (G) Western blotting showing the upregulation of CHK2, phosph-CHK2 (T68), and TTF1 in Hela cells after BMS1 knockdown. In C and F, **P < 0.01, ***P < 0.001. |