
Figure 2
- ID
- ZDB-FIG-220203-49
- Publication
- Zhu et al., 2021 - Nucleolar GTPase Bms1 displaces Ttf1 from RFB-sites to balance progression of rDNA transcription and replication
- Other Figures
- All Figure Page
- Back to All Figure Page
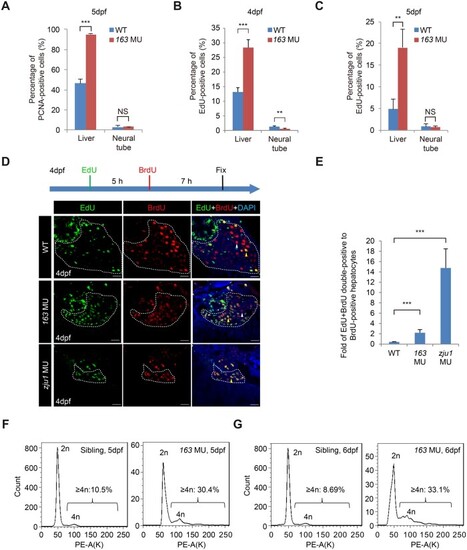
Bms1l mutations cause genomic DNA partial over-replication and arrest cells at the S-phase. (A) Immunostaining of PCNA showing the significant increase in the percentage of PCNA-positive cells in bms1lsq163/sq163 hepatocytes but not in the NT when compared with WT at 5dpf. Hepatocyte samples: three WT embryos, 3090 cells counted; three bms1lsq163/sq163 embryos, 1336 cells counted. For NT cells, the pixels of PCNA-positive and DAPI-positive signals were captured by Photoshop and were used to obtain the percentage of PCNA-positive cells as shown. (B and C) The percentage of EdU-positive hepatocytes were significantly higher in bms1lsq163/sq163 than in WT both at 4dpf (B) and 5dpf (C). Hepatocyte samples in B: four WT embryos, 9422 cells counted; three bms1lsq163/sq163 embryos, 1958 cells counted. In C: four WT embryos, 7995 cells counted; three bms1l163/sq163 embryos, 1684 cells counted. (D and E) EdU and BrdU were sequentially injected into 4dpf embryos as shown (D, top panel). Staining of EdU and BrdU was performed (D, lower panels). The ratios of BrdU + EdU double-positive vs. BrdU-only-positive hepatocytes were significantly higher in bms1lsq163/sq163 and bms1lzju1sq163 mutants than in WT at 4dpf (E), demonstrating DNA over-replication in the two mutants. Samples: five WT embryos, 2591 cells counted; seven bms1l163/sq163 embryos, 1245 cells counted; four bms1lzju1/zju1 embryos, 593 cells counted. Scale bar, 20 μm. (F and G) Flow cytometry analysis showing a significant increase in the ratio of ≥4n hepatocytes in bms1lsq163/sq163 compared with its siblings (the pool of bms1+/+ and bms1sq163/+) at 5dpf (F) and 6dpf (G). Average percentages of ≥4n hepatocytes from three repeats for each genotype were provided. PE-A(K), signal intensity in PE channel. In A‒C, E, and F, **P < 0.01, ***P < 0.001; NS, no significance. |