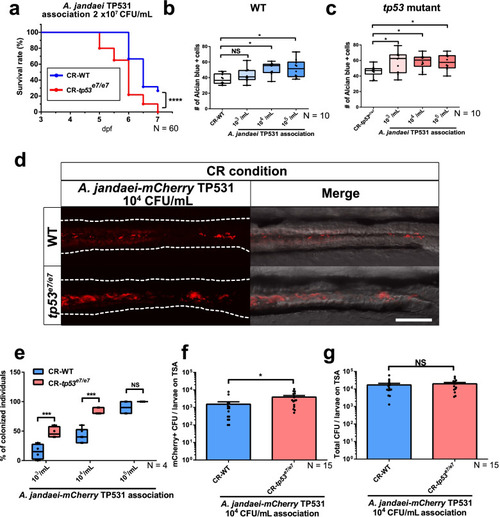
Aeromonas jandaei TP531 preferentially elicits increased goblet cell numbers and colonizes GITs of tp53 mutants. a A lethality curve of Aeromonas jandaei TP531 association (2 × 10⁷ CFU/mL) with WT or tp53 mutant larvae starting at 3 dpf. N = 60 each. The lethality curve was statistically estimated by Gehan-Breslow-Wilcoxon test. b, c Association of increasing titers of A. jandaei TP531 (103~105 CFU/mL) increased the number of Alcian blue-positive goblet cells in the mid-distal intestines of tp53 mutants (c) more than of WT (b) at 7 dpf. N = 10 each. d Association of mCherry-tagged A. jandaei TP531 (104 CFU/mL) preferred to colonize the GITs of tp53 mutants under CR (conventionally raised) condition. White dashed lines denote boundaries of GITs based on DIC bright field images. Scale bar = 50 μm. e A boxed plot of percentages of WT or tp53 mutants larvae colonized by mCherry-tagged A. jandaei TP531 at 7 dpf. N = 4 each. The boxed plots were statistically estimated by non-parametric Friedman test followed by Dunn’s multiple comparisons test. f, g Bar graph of the numbers of mCherry-tagged A. jandaei TP531 colonies (f) or total colonies (g) in TSA plates. N = 15 each. The bar graph was statistically estimated by Mann-Whitney U test. Data are represented as mean ± SEM. *< p = 0.05; ***< p = 0.005; ****< p = 0.0001. NS not significant
|
