
Fig. 5
- ID
- ZDB-FIG-220131-77
- Publication
- Lee et al., 2022 - Host tp53 mutation induces gut dysbiosis eliciting inflammation through disturbed sialic acid metabolism
- Other Figures
- All Figure Page
- Back to All Figure Page
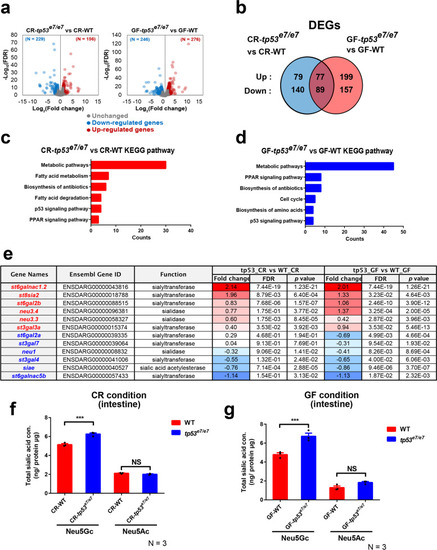
Sialic acid metabolism pathway is compromised in tp53 mutants. a The volcano plots illustrating the comparison of the expression signature of the GITs of WT and tp53 mutants under CR- or GF- conditions at 7 dpf. Each sample was repeated two times. The colored dots show the differentially up- (red) or down- (blue) regulated or unchanged (gray) genes in the GITs of tp53 mutant compared with WT under CR- or GF- conditions at 7 dpf (|log2FC| > 1, FDR < 0.05). b Ben diagram illustrating that 385 (156 upregulated and 229 downregulated) or 522 (276 upregulated and 246 downregulated) differentially expressed genes (DEGs) were identified when CR-WT vs. CR-tp53 mutants or GF-WT vs. GF-tp53 mutants was compared, respectively (|log2FC| > 1, FDR < 0.05). 166 DEGs were common between those two conditions. c, d KEGG pathway analyses of CR-WT vs. CR-tp53 mutants (c) or GF-WT vs. GF-tp53 mutants (d) revealed major altered pathways under each comparison, with a change in metabolic pathways most affected. e A list of DEGs implicated in sialic acid metabolism. Fold changes (log2 scale) in red or blue denote up-regulated or down-regulated expression, respectively, with the color intensity correlated with the magnitude of fold changes. f, g HPLC-FLD analyses of total Neu5Gc and Neu5Ac amounts of WT or tp53 mutant GITs under CR (f)- or GF (g)- condition. Bar graphs were statistically estimated by one-way ANOVA followed by Newman-Keuls multiple comparisons test. Data are represented as mean ± SEM. N = 3 each. ***< p = 0.005. NS not significant |