
Figure 4
- ID
- ZDB-FIG-220131-529
- Publication
- Hentig et al., 2021 - Prophylactic Activation of Shh Signaling Attenuates TBI-Induced Seizures in Zebrafish by Modulating Glutamate Excitotoxicity through Eaat2a
- Other Figures
- All Figure Page
- Back to All Figure Page
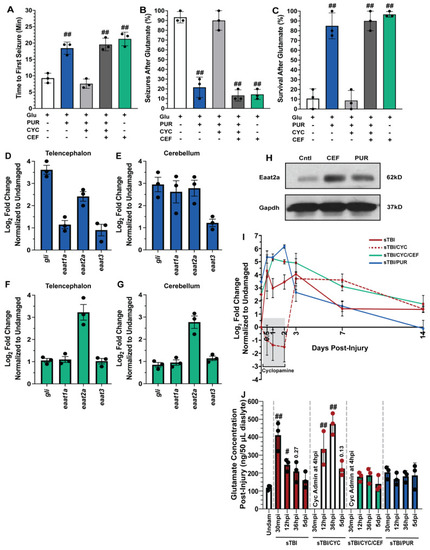
Shh activation combats excitotoxicity and upregulates Eaat2a. Undamaged fish with and without Shh modulation and ceftriaxone treatment were exposed to 5 mM glutamate in fish water (n = 90 fish per control/experimental group). (A) Quantification of time to first seizure, (B) percent of the group to display at least 1 seizure event, and (C) percent of the group that survived for 1 h. (D,E) Expression of Shh component, gli, and excitatory amino acid transporter (eaat) genes by qRT-PCR revealed that purmorphamine increased gli and eaat2a mRNAs in both undamaged telencephalons and cerebellums (n = 3 per control/experimental group, with 5 pooled telencephalons or cerebellums/trial). (F,G) Administration of ceftriaxone increased eaat2a mRNA expression levels without Shh activation in undamaged telencephalons and cerebellums (n = 3 per control/experimental group, with 5 pooled telencephalons or cerebellums/trial). (H) Expression of Eaat2a in the undamaged cerebellum (5 pooled cerebellums per control/experimental group) following either purmorphamine or ceftriaxone treatment was assessed by immunoblot, using GAPDH as a loading control (H, top and lower bands, respectively). Eaat2a protein expression was increased following either purmorphamine or ceftriaxone treatment compared to controls. (I) Expression of eaat2a by qRT-PCR in sTBI fish with either Shh signaling activated, inhibited, or inhibited and cotreated with ceftriaxone at 12 hpi to 14 dpi (n = 3 per control/experimental group, with 5 pooled cerebellums/group). (J) Microdialysis was performed to quantify extracellular glutamate levels in undamaged and sTBI fish with and without Shh modulation and ceftriaxone treatment at 30 min post-injury, 12 and 36 hpi, and 5 dpi (n = 3 per control/experimental group). In panels A-C, the plus sign (+) denotes application of the reagent and the minus sign (-) denotes the absence of the reagent. Grey box denotes period of cyclopamine administration. Statistical analyses were performed with a one-way ANOVA followed by Dunnett’s multiple comparison post hoc test, # p < 0.05, ## p < 0.01. |