
FIGURE
Fig. 7
- ID
- ZDB-FIG-220131-150
- Publication
- Fabian et al., 2022 - Lifelong single-cell profiling of cranial neural crest diversification in zebrafish
- Other Figures
- All Figure Page
- Back to All Figure Page
Fig. 7
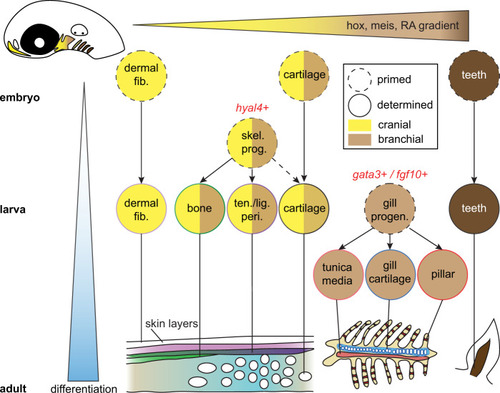
Cell types progressively emerge at distinct positions along the anterior-posterior axis of the developing head. Time is represented along the y-axis from young (white) to old (blue). Positional information is represented along the x-axis from anterior (yellow) to posterior (brown). Cell types are denoted by circles, with skeletal progenitors distinguished by hyal4 expression and gill progenitors by gata3 and fgf10 gene expression. Mature cell types are schematized at the bottom. |
Expression Data
Expression Detail
Antibody Labeling
Phenotype Data
Phenotype Detail
Acknowledgments
This image is the copyrighted work of the attributed author or publisher, and
ZFIN has permission only to display this image to its users.
Additional permissions should be obtained from the applicable author or publisher of the image.
Full text @ Nat. Commun.