
Fig. 6
- ID
- ZDB-FIG-211201-262
- Publication
- Winter et al., 2021 - Functional brain imaging in larval zebrafish for characterising the effects of seizurogenic compounds acting via a range of pharmacological mechanisms
- Other Figures
- All Figure Page
- Back to All Figure Page
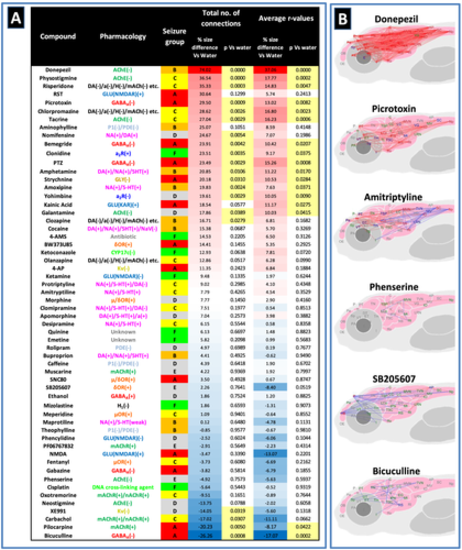
Assessment of average functional connectivity across the whole brain. Panel (a) shows a comparison of the functional connectivity across the whole brain of larvae exposed to each compound compared with the resting state network animals. Data are shown as the % difference in the number of functional connections between the two groups (where r > .7) along with the corresponding p value generated after Mann–Whitney U testing, along with the same parameters for the average r value of the two groups. Compounds are listed in order of the % size difference from the highest to lowest with values highlighted in red signifying increases and those in a blue decreases compared with the control value. p values highlighted in pale yellow were statistically significant (p < .05). Note that most compounds with no known association to seizure showed no change in functional connectivity versus the resting state network, whereas the stronger seizurogenic compounds (especially the precipitants) generally showed an increase in functional connectivity. Note also that some known seizurogenic compounds also exhibited a decrease in functional connectivity compared with the resting state network. Panel (b) shows representative connectomes from compounds across the full range of values from those showing a large increase in functional connectivity (top), to those showing a large decrease in functional connectivity (bottom). Data shown are connections that exhibited a different mean r value compared with the equivalent connection as a mean of all the vehicle (water) control animals tested. Nodes connected with a red line represent significant increases and blue significant decreases in the r value compared with the control. Nodes labelled in green showed 1 or more significantly different connections, in blue, 5 or more and in red 10 or more. Comparisons here were undertaken using Mann–Whitney U tests with a Bonferroni correction applied (significance at p < .00006). n = 12–19 larvae per drug exposed group and n = 516 for the resting state network. Abbreviated brain regions as detailed in Figure 3. Note: Positions of regions approximate to allow spacing of nodes and optimal visualisation of connectivity |