
Fig. 5
- ID
- ZDB-FIG-211201-261
- Publication
- Winter et al., 2021 - Functional brain imaging in larval zebrafish for characterising the effects of seizurogenic compounds acting via a range of pharmacological mechanisms
- Other Figures
- All Figure Page
- Back to All Figure Page
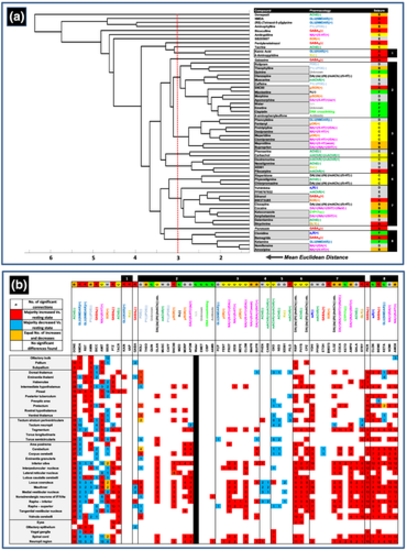
Results of the hierarchical cluster and post-hoc analysis of the functional connectivity data. Panel (a) shows the dendrogram resulting from the cluster analysis on the Euclidean distances between mean r values for each of the compounds assessed. Identified groupings showing a mean Euclidean distance of no more than 3 (represented by the red dotted line in the dendrogram) are shown in the right hand table denoted by borders, along with the corresponding primary pharmacological mechanism of action and seizure liability category (as defined in Figure 2). Grey boxes represent the closest sub groupings. Numbers in the right hand column are references for each defined grouping that occurs in the corresponding dendrogram. Note in particular, the grouping of specific compounds that share a primary mechanism of action (e.g., especially groups 3, 4 and 5). Panel (b) shows the results of the post hoc assessment of changes in functional connectivity of each brain region in compound-treated animals, versus the same region in the resting state network. Abbreviated compound names, along with the primary pharmacological mechanism of action, seizure liability category and dendrogram group number are shown along the top of the table, with each registered brain region shown down the left hand side of the table. Each cell shows the number of connections to that region for which the mean r value had significantly changed versus the equivalent connection in the resting state network. Those boxes coloured red showed a majority of increased r values, blue a majority of decreases and orange an equal number of increases and decreases (see Figures S6 and S7 for all compound connectomes). These data reveal the brain regions in which functional connectivity was most significantly changed after compound treatment. Comparisons were undertaken using Mann–Whitney U tests with a Bonferroni correction applied (significance at p < .00006). A blank cell signifies there was no change in functional connectivity with any other region when compared to the resting state network. n = 12–19 larvae per drug exposed group and n = 516 for the resting state network |