
- Title
-
Functional brain imaging in larval zebrafish for characterising the effects of seizurogenic compounds acting via a range of pharmacological mechanisms
- Authors
- Winter, M.J., Pinion, J., Tochwin, A., Takesono, A., Ball, J.S., Grabowski, P., Metz, J., Trznadel, M., Tse, K., Redfern, W.S., Hetheridge, M.J., Goodfellow, M., Randall, A.D., Tyler, C.R.
- Source
- Full text @ Br. J. Pharmacol.
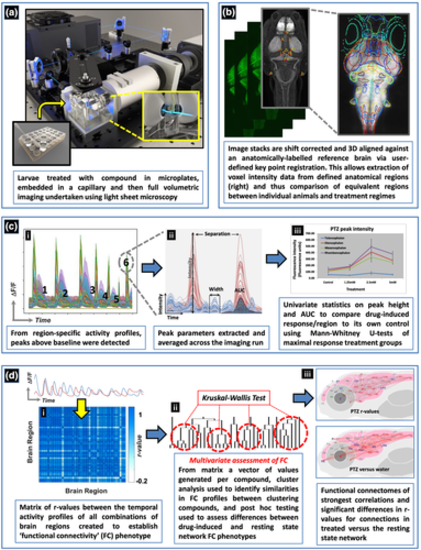
Schematic of the experimental process used to obtain 4D whole brain neural activity data from drug treated larval elavl3:GCaMP6s zebrafish. The experimental process and resultant data analysis procedures are summarised in order of panels a–d. (a) Animals were first exposed to the compound and then imaged using light sheet microscopy. (b) The resultant image stacks were 3D aligned to a standardised brain image library (Z-brain atlas) and subsequent 3D registration allowed extraction of anatomical region-specific fluorescence data. (c) The extracted region-specific fluorescence intensity temporal profiles were then analysed to reveal regional changes between treated and untreated animals. (i) Peaks were automatically identified from the temporal profiles (e.g. labelled 1–6) and (ii) peak parameters for each profile extracted. (iii) Peak height and area under the curve (AUC) were then analysed using univariate statistics to identify brain regions showing altered neural activity versus the same area in the corresponding group of control animals. (d) For the analysis of functional connectivity (FC), (i) Pearson's correlation coefficients (r) were calculated between the temporal activity profiles of each pair of regions to provide a matrix summarising measures of the level of functional connectivity between each pair of nodes. An r value of >0.7 between two regions suggested these areas were functionally connected as both showed correlated temporal activity profiles. (ii) Multivariate statistical analysis of the FC data was then undertaken, followed by cluster analysis of the resultant Euclidean distances, to assess similarities in the resultant phenotypes and whether groupings contained compounds sharing common mechanisms of pharmacological action. Post hoc testing of the resultant groupings using Kruskal–Wallis tests then revealed the brain regions and/or connections driving these similarities/differences. (iii) The r values from the FC matrices generated for each compound were visualised in the form of a connectivity map of the brain (a functional connectome ~ upper panel) and as exposed animal data versus the resting state network by comparing the r values for each connection between treated and untreated groups using Mann–Whitney U tests (lower panel) |
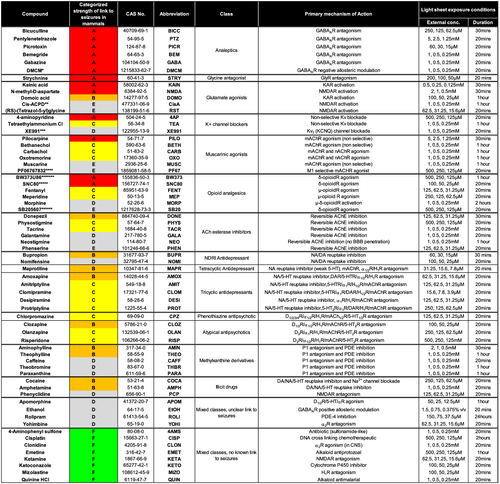
Summary of the test chemicals and experimental exposure conditions used in the current study. Information shown left to right: compound name; strength of the association with seizure induction in mammals (see below); Chemical Abstracts Service (CAS) registry number; abbreviation as used in other figures; pharmacological class; primary mechanism of action; and exposure concentration and times used the Ca2+ imaging. The strength of the association with seizure induction in mammals based on the scientific literature is classified as follows: A - strong link—tool compounds/precipitants; B - clear association in clinic/nonclinical studies; C - measurable association in clinic and/or some nonclinical evidence; D - limited clinical/non clinical data, but weak or conflicting and/or seizure-inducing only under specific circumstances (e.g., overdose or withdrawal); E - mechanistic link only, no published confirmatory data; and F - no known link to seizures (seizure negative). Abbreviations: AChE = acetylcholine esterase; DR = dopamine receptor; αR = α-adrenoreceptor; HR = histamine receptor; mAChR = muscarinic acetylcholine receptor; 5-HTR = 5-hyroxytryptamine receptor; GABAR = γ-aminobutyric acid receptor; KAR = kainic acid receptor; NMDAR = glutamatergic N-methyl-d-aspartate receptor; GLYR = glycine receptor; Kv = voltage-gated K+ channel; NA = noradrenaline; DA = dopamine; 5-HT = 5-hyroxytryptamine (serotonin); P1 = adenosine receptor; PDE = phosphodiesterase; μ/δ-opioidR = mu/delta-opioid receptor; LOQ = limit of quantification. *DMCM (methyl-6,7-dimethoxy-4-ethyl-beta-carboline-3-carboxylate); **cis-ACPD ((±)-1-Aminocyclopentane-cis-1,3-dicarboxylic acid); ***XE991 (10,10-bis(4-Pyridinylmethyl) -9(10H)-anthracenone dihydrochloride); ****PF-06767832 (1,5-Anhydro-2,3-dideoxy-3-[[[5-methyl-4-[[4-(4-thiazolyl)phenyl]methyl]-2-pyridinyl]carbonyl]amino]-l-threo-pentitol, N-((3R,4S)-3-hydroxytetrahydro-2H-pyran-4-yl)-5-methyl-4-[4-(1,3-thiazol-4-yl)benzyl]-pyridine-2-carboxamide); *****SNC80 ((+)-4-[(αR)-α-((2S,5R)-4-Allyl-2,5-dimethyl-1-piperazinyl)-3-methoxybenzyl]-N,N-diethylbenzamide); ******SB205607 or TAN-67, ((R*,S*)-(±)-2-methyl-4aa-(3-hydroxyphenyl)-1,2,3,4,4a,5,12,12aa-octahydroquinolino[2,3,3-g]isoquinoline dihydrobromide); *******BW373U86 4-[(αR*)-α-((2S*,5R*)-4-Allyl-2,5-dimethyl-1-piperazinyl)-3-hydroxybenzyl]-N,N-diethylbenzamide). All test chemicals were obtained from sigma-Aldrich (Gillingham, UK) or Tocris (Bristol, UK) |
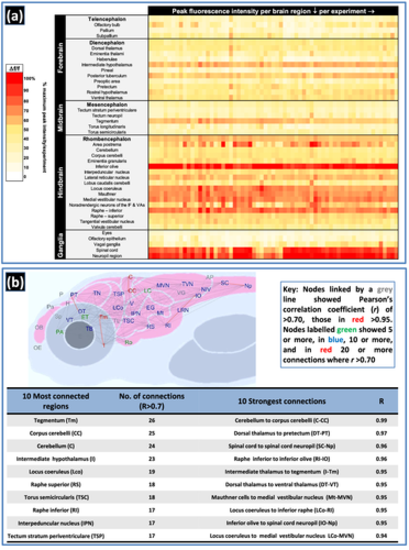
Summary of peak fluorescence intensity and functional connectivity data from vehicle (water) control larvae tested across 65 experimental datasets. Panel (a) shows the peak fluorescence intensity data per brain region of interest (ROI) as the average baseline-corrected fluorescence intensity (Δf/f = (f1 − f0)/f0 * 100, where f1 = peak fluorescence intensity and f0 = baseline fluorescence intensity within each ROI) of larvae within each control group (per column), presented as the % of the maximum peak intensity shown within that experimental dataset (n = 7–9 larvae per group). The most active brain region in each dataset is represented by 100%, with decreasing red/orange colour intensity representing ROIs with lower levels of comparative activity. Note the high consistency across experiments in brain regions exhibiting elevated basal activity, especially those that showed a mean peak intensity of >33% higher basal activity than the overall mean across all regions: intermediate hypothalamus, area postrema, inferior olive, locus coeruleus, Mauthner cells, medial vestibular nucleus, inferior raphe, spinal cord and spinal cord neuropil. Panel (b) shows the resting state functional connectome of control larvae presented as the average across 65 experimental datasets along with a table summarising the 10 most connected brain regions and the 10 strongest functional connections (n = 516 larvae). Abbreviated brain regions are as follows: area postrema (AP); cerebellum (C); corpus cerebelli (CC); dorsal thalamus (DT); eyes (E); eminentia granularis (EG); eminentia thalami (ET); habenulae (H); intermediate hypothalamus (I); inferior olive (IO); interpeduncular nucleus (IPN); lobus caudalis cerebelli (LC); locus coeruleus (Lco); lateral reticular nucleus (LRN); Mauthner (Mt); medial vestibular nucleus (MVN); noradrenergic neurons of the interfascicular and vagal areas (NIV); spinal cord neuropil (Np); olfactory bulb (OB); olfactory epithelium (OE); pineal (P); preoptic area (PA); pallium (pa); pretectum (PT); raphe inferior (RI); rostral hypothalamus (Ro); raphe superior (RS); spinal cord (SC); subpallium (Sp); posterior tuberculum (TB); torus longitudinaris (TL); tegmentum (tm); tectum neurophil (TN); torus semicircularis (TSC); tectum stratum periventriculare (TSP); tangential vestibular nucleus (TVN); Valvula cerebelli (V); vagal ganglia (VG); ventral thalamus (VT). Note: Positions of regions approximate to allow spacing of nodes and visualisation of connections |
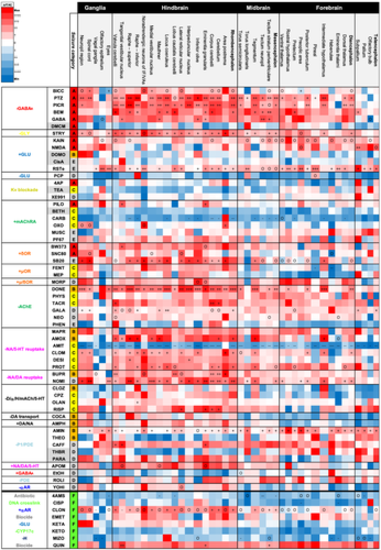
Summary of peak GCaMP6s fluorescence intensity data measured in brain regions of larvae exposed to a range of neuroactive test compounds. Column 1 (left) shows the primary pharmacological mechanism of action; column 2, the abbreviated compound name; column 3, the strength of association with seizure induction in mammals according to the categories in Figure 2. Data (column 4 onwards) are expressed as % increase over the same regions of interest (ROI) from the corresponding water control group (ΔfT/fC = (f1 − f0)/f0 * 100, where f1 = treated group and f0 = control group, mean fluorescence peak height) (n = 6–10 larvae per group). Colour coding signifies the magnitude of effect with increasing red colour intensity signifying an increase, white no change and blue a decrease compared to the control. Within each box, statistically significant differences between compound-treated and control groups are shown (p < .017): + signifying a significant increase at one concentration, ++ at two and +++ at three. -, -- and --- signifies a significant decrease for the same categories. O signifies an overall difference only, following Kruskal–Wallis analysis. Abbreviations are as follows: GABA = γ-aminobutyric acid; GLU = glutamate; ACh = acetylcholine; P1/PDE = adenosine/phosphodiesterase; NA/DA/5-HT = noradrenaline/dopamine/5-hydroxytryptamine (serotonin); Kv = potassium channels; OR = opioid receptor; αR = α-adrenoreceptor; H = histamine; CYP = cytochrome P450) |
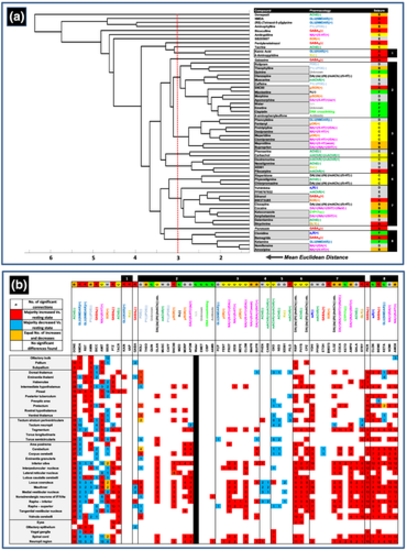
Results of the hierarchical cluster and post-hoc analysis of the functional connectivity data. Panel (a) shows the dendrogram resulting from the cluster analysis on the Euclidean distances between mean r values for each of the compounds assessed. Identified groupings showing a mean Euclidean distance of no more than 3 (represented by the red dotted line in the dendrogram) are shown in the right hand table denoted by borders, along with the corresponding primary pharmacological mechanism of action and seizure liability category (as defined in Figure 2). Grey boxes represent the closest sub groupings. Numbers in the right hand column are references for each defined grouping that occurs in the corresponding dendrogram. Note in particular, the grouping of specific compounds that share a primary mechanism of action (e.g., especially groups 3, 4 and 5). Panel (b) shows the results of the post hoc assessment of changes in functional connectivity of each brain region in compound-treated animals, versus the same region in the resting state network. Abbreviated compound names, along with the primary pharmacological mechanism of action, seizure liability category and dendrogram group number are shown along the top of the table, with each registered brain region shown down the left hand side of the table. Each cell shows the number of connections to that region for which the mean r value had significantly changed versus the equivalent connection in the resting state network. Those boxes coloured red showed a majority of increased r values, blue a majority of decreases and orange an equal number of increases and decreases (see Figures S6 and S7 for all compound connectomes). These data reveal the brain regions in which functional connectivity was most significantly changed after compound treatment. Comparisons were undertaken using Mann–Whitney U tests with a Bonferroni correction applied (significance at p < .00006). A blank cell signifies there was no change in functional connectivity with any other region when compared to the resting state network. n = 12–19 larvae per drug exposed group and n = 516 for the resting state network |
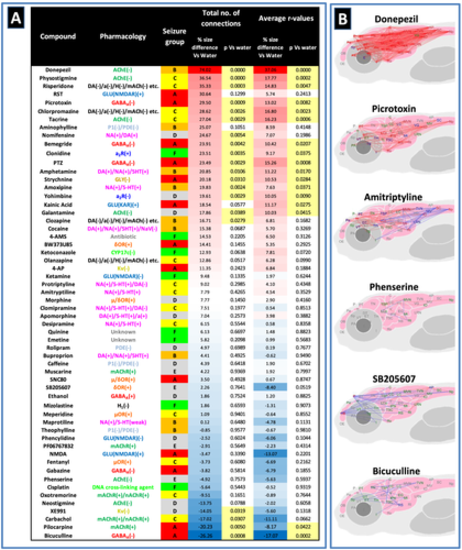
Assessment of average functional connectivity across the whole brain. Panel (a) shows a comparison of the functional connectivity across the whole brain of larvae exposed to each compound compared with the resting state network animals. Data are shown as the % difference in the number of functional connections between the two groups (where r > .7) along with the corresponding p value generated after Mann–Whitney U testing, along with the same parameters for the average r value of the two groups. Compounds are listed in order of the % size difference from the highest to lowest with values highlighted in red signifying increases and those in a blue decreases compared with the control value. p values highlighted in pale yellow were statistically significant (p < .05). Note that most compounds with no known association to seizure showed no change in functional connectivity versus the resting state network, whereas the stronger seizurogenic compounds (especially the precipitants) generally showed an increase in functional connectivity. Note also that some known seizurogenic compounds also exhibited a decrease in functional connectivity compared with the resting state network. Panel (b) shows representative connectomes from compounds across the full range of values from those showing a large increase in functional connectivity (top), to those showing a large decrease in functional connectivity (bottom). Data shown are connections that exhibited a different mean r value compared with the equivalent connection as a mean of all the vehicle (water) control animals tested. Nodes connected with a red line represent significant increases and blue significant decreases in the r value compared with the control. Nodes labelled in green showed 1 or more significantly different connections, in blue, 5 or more and in red 10 or more. Comparisons here were undertaken using Mann–Whitney U tests with a Bonferroni correction applied (significance at p < .00006). n = 12–19 larvae per drug exposed group and n = 516 for the resting state network. Abbreviated brain regions as detailed in Figure 3. Note: Positions of regions approximate to allow spacing of nodes and optimal visualisation of connectivity |