
Figure 4
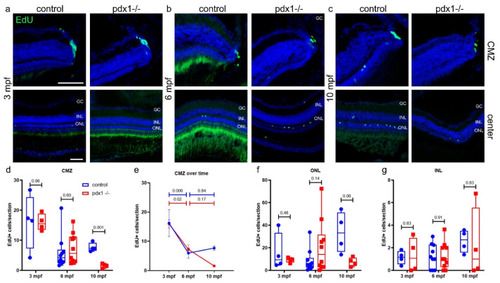
Chronic hyperglycemia impacts proliferation in progenitor populations. Cryosections of control and pdx1−/− retinas at 3 mpf (a), 6 mpf (b) and 10 mpf (c). Cryosections were stained for EdU to identify cells that underwent proliferation (green) and counterstained with DAPI (blue). (d,e) Quantification of EdU positive cells in the ciliary marginal zone (CMZ) depicted in a box plot (d) and the same data shown as a line plot over time (e). Quantification of EdU positive cells in the ONL (f) and the INL (g) at 3, 6 and 10 mpf. Box plot extends from 75% to 25%, showing all data points, line indicates median. n = 4–10 fish per time point. Scale bar: 50 µm. (GC, ganglion cell layer; INL, inner nuclear layer; ONL, outer nuclear layer). |
| Fish: | |
|---|---|
| Observed In: | |
| Stage: | Adult |