
Figure 5.
- ID
- ZDB-FIG-211111-62
- Publication
- Madden et al., 2021 - Central nervous system hypomyelination disrupts axonal conduction and behaviour in larval zebrafish
- Other Figures
- All Figure Page
- Back to All Figure Page
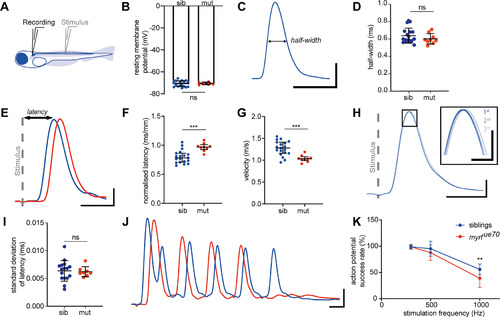
Whole cell current-clamp recordings from Mauthner cells demonstrate slower conduction velocity times and abnormal spiking profiles in myrfue70 mutants. A, Electrophysiological preparation for recording from Mauthner neuron in a whole-cell current clamp configuration while stimulating with an extracellular monopolar field electrode midway through the spinal cord. B, Resting membrane potential is unchanged in siblings (n = 18 cells): −70.82 ± 2.76 mV, mutants (n = 6 cells): −70.68 ± 1.25 mV, p = 0.9077 at 6 dpf. C, Sample trace of an action potential recorded at 6 dpf in a wild-type fish illustrating the measurement of half-width. Half-width is described as width of action potential (ms) at its half height. D, Half-width of action potential is unchanged [siblings (n = 18 cells): 0.64 ± 0.09 ms, mutants (n = 9 cells): 0.60 ± 0.06 ms, p = 0.2610 at 6 dpf]. E, An example of current–clamp recording from Mauthner neuron in a 6 dpf wild type and mutant following field stimulation (stimulus artifact is indicated by a gray dashed line). Latency is described as time from the onset of stimulus artifact to the peak of action potential. F, Normalized action potential latency is increased in mutants at 6 dpf [siblings (n = 19 cells): 0.80 ± 0.11 ms/mm, mutants (n = 9 cells): 0.97 ± 0.07 ms/mm, p = 0.0003 at 6 dpf]. G, Conduction velocity of Mauthner action potentials is significantly decreased in mutant larvae [siblings (n = 19 cells): 1.27 ± 0.17 m/s, mutants (n = 9 cells): 1.04 ± 0.08 m/s, p 0.0005 at 6 dpf]. H, Sample traces of three subsequent action potentials recorded from the same wild-type Mauthner cell at 6 dpf superimposed and aligned to the peak of stimulus artifact. The area outlined by the rectangle is magnified in the inset and demonstrates slight imprecision of action potential arrival. I, Precision of action potential arrival is comparable in siblings and mutants [siblings (n = 16 cells): 0.0064 ± 0.0019 ms, mutants (n = 8 cells): 0.0062 ± 0.0009 ms, p = 0.8166 at 6 dpf]. J, Sample trace of a train of action potentials fired following 10 stimuli at 1000 Hz at 6 dpf in a myrfue70 mutant and sibling. K, Mauthner neurons in mutant larvae do not sustain prolonged action potential trains of high-frequency stimulation [siblings (n = 19 cells): 55.79 ± 10.17% mutants (n = 9 cells): 38.89 ± 17.64% at 6 dpf, p = 0.0014 at 6 dpf]. For B, D, F, G, I, K, error bars represent mean ± SD. Unpaired t test for B, D, F, G, I and a two-way ANOVA for K. Scale bars: 10 mV and 1 ms (C, E, H, J) and 5 mV and 200 μs (H, inset). |
| Fish: | |
|---|---|
| Observed In: | |
| Stage: | Day 6 |