
- Title
-
Central nervous system hypomyelination disrupts axonal conduction and behaviour in larval zebrafish
- Authors
- Madden, M.E., Suminaite, D., Ortiz, E., Early, J.E., Koudelka, S., Livesey, M.R., Bianco, I.H., Granato, M., Lyons, D.A.
- Source
- Full text @ J. Neurosci.
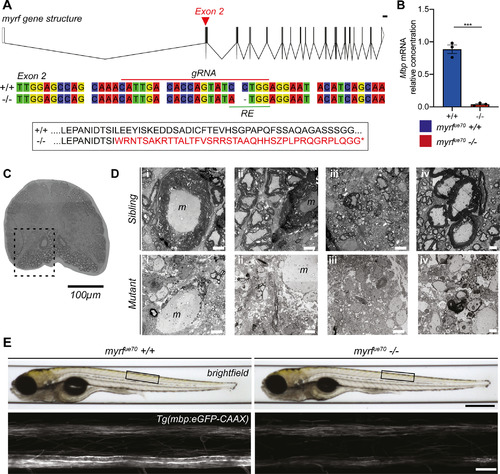
myrfue70 mutants display a gross reduction in the level of CNS myelination at the adult and larval stages. A, top, myrf gene structure composed of 27 exons. Red arrowhead marks the location of the mutation in exon 2. Scale bar: 1000 bp. Schematic created using http://wormweb.org. Middle, Wild-type and mutant nucleotide sequences spanning the mutagenesis site. The gRNA target site (red line) and restriction enzyme (RE) recognition site (green line) are labeled. Bottom, Amino acid sequence indicating that the myrfue70 mutation results in shift in the open reading frame leading to downstream coding for a premature stop codon (*). B, The relative concentration of mbp mRNA is reduced by 95% in mutants (0.04 ± 0.03 au) compared with wild types (1.003 ± 0.13 au, p = 0.0002, unpaired t test, N = 3 adult brains per genotype). Error bars represent mean ± SD. C, Transverse section of the spinal cord in an adult myrfue70 sibling showing extensive myelination of ventral spinal cord (dashed box). 20× objective. Scale bar: 100 µm. D, TEM images of the spinal cord in the region of the ventral spinal tract (outlined in C) in myrfue70 adult siblings (top) and mutants (bottom). Panels i–iv display different fields of view within the region of interest. Thick myelin sheaths are clearly visible in siblings, particularly surrounding the Mauthner axon. There is a lack of myelin surrounding the Mauthner axon in the mutant sample, and distinct reduction in the level of myelination in the remainder of surrounding spinal cord. Occasional hypomyelinated and dysmyelinated axons can be observed in the mutant samples. Scale bar: 5 µm (panels i–iii) and 1 µm (panel iv). m, Mauthner axon. E, top, Brightfield images of myrfue70 wild-type and mutant larvae at 6 dpf. Black box defines the anatomic region imaged across animals. Scale bar: 0.5 mm. Bottom, Confocal microscopy images of the spinal cord at 6 dpf in myrfue70 Tg(mbp:eGFP-CAAX) larvae. Scale bar: 20 µm. |
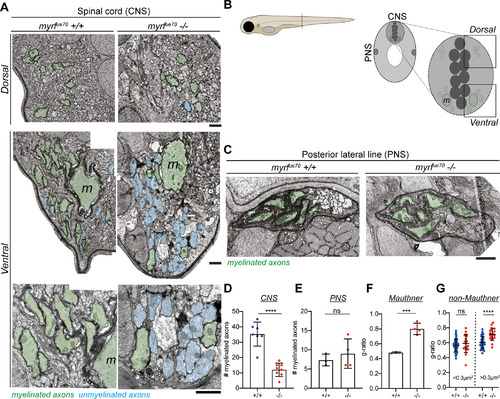
myrfue70 mutants display CNS-specific hypomyelination at 6 dpf. A, TEM images of the myelinated tracts in the dorsal (top row) and ventral spinal cord (bottom rows). Scale bar: 1 µm. B, Schematic of the transverse section of a 6 dpf larval zebrafish at the level of the urogenital opening. Inset, transverse section of the spinal cord at the same level. Myelinated (green) axons are located in the ventral and dorsal spinal tracts of the spinal cord (CNS) as well as the posterior lateral line (PNS). m, Mauthner axons. C, TEM images of the posterior lateral line at 6 dpf. Scale bar: 1µm. D, The average number of myelinated axons in one hemi-spinal cord is reduced by 66% in mutants (wild types: 35.29 PHENOTYPE:
|

myrfue70 mutants have fewer oligodendrocytes which produce less myelin and fail to maintain myelin sheaths over time. A, Confocal images of the spinal cord at 6 dpf in sibling control and myrfue70 Tg(mbp:nls-eGFP) larvae. Scale bar: 100 µm. B, Oligodendrocyte numbers in the spinal cord at 6 dpf (wild-type: 304.8 |
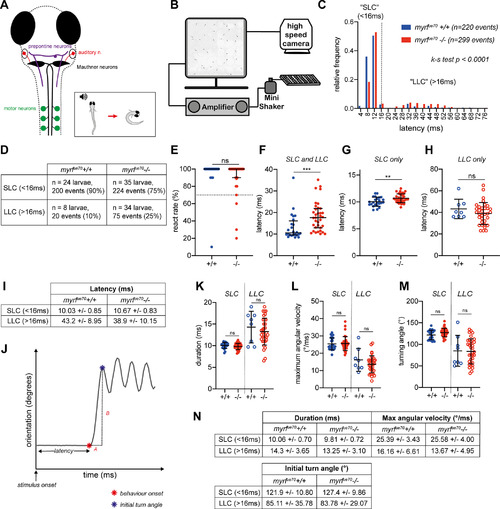
myrfue70 mutants exhibit increased latency to perform startle responses, and a tendency to perform avoidance behavior, in response to defined acoustic stimuli. A, Overview of the neuronal circuitry involved in motor response to auditory stimuli. Startle response (SLC): sensory input from the ear, via the auditory nerve (red), is received at the lateral dendrite of the Mauthner cell body (black). The axon of the Mauthner cell crosses into the contralateral aspect of the spinal cord where it extends along the ventral tract to recruit motor neurons directly along the length of the larvae. Recruitment of motor neurons allows muscle contraction on the side of the body contralateral to the stimulus, allowing a rapid, high-velocity c-bend (motor response) away from the stimulus (inset). Avoidance behavior (LLC): sensory input is detected by prepontine neurons (purple) in the hindbrain, which recruit ipsilateral motor neurons indirectly, resulting in a low-velocity, longer latency, c-bend away from the stimulus. B, Schematic of the behavioral rig. C, Relative frequency histogram displaying the distribution of latencies for behavioral responses in response to acoustic stimuli in wild-type and mutant larvae (N = 24 wild-type larvae, n = 220 events; N = 35 mutant larvae, n = 299 events; Kolmogorov–Smirnov test, p ≤ 0.0001). D, Number and proportion of events (SLC vs LLC) per genotype. E, React rate per fish (median react rate = 100% in both wild types and mutants, p = 0.24, Mann–Whitney test, N = 25 wild-type larvae, N = 38 mutant larvae). Larvae are excluded from subsequent analysis if they exhibit a react rate <70%. F, Average latency values per fish [wild type: 10.55 ms (9.6–16.15 ms), mutants: 17.6 ms (12.9–21.88 ms), p = 0.003, Mann–Whitney test]. G, Average latency of SLC (<16 ms; wild types: 10.03 ± 0.85 ms, mutants: 10.67 ± 0.83 ms, p = 0.006, unpaired t test). H, Average latency of LLC (>16 ms; wild types: 43.20 ± 8.95 ms; mutants: 38.91 ± 10.15 ms, p = 0.28, unpaired t test). I, Mean and SDs values for SLC and LLC responses per genotype. J–M, Analysis of c-bend kinematics. J, Example trace of orientation over time during a behavioral response to an acoustic stimulus. C-bend kinematics are calculated from individual traces for each response per fish. Latency is the time from stimulus onset to behavioral onset (red star). C-bend duration (A) is time from behavior onset to initial turn angle (blue star). Maximum angular velocity is defined as the change in orientation over time (B/A). Turning angle equates to the initial turn angle. K, Initial turn duration (SLC: wild types: 10.06 ± 0.70 ms, mutants: 9.81 ± 0.72 ms, p = 0.20, unpaired t test; LLC: wild types: 14.30 ± 3.65 ms, mutants: 13.25 ± 3.10, p = 0.42, unpaired t test). L, Maximum angular velocity [SLC: wild types: 24°/ms (22.78–28.68°/ms), mutants: 25°/ms (23.10–26.60°/ms), p = 0.73, Mann–Whitney test; LLC: wild types: 16.16 ± 6.61°/ms, mutants: 13.67 ± 4.95°/ms, p = 0.24, unpaired t test]. M, Initial turn angle (SLC: wild types: 121.9 ± 10.80°, mutants: 127.4 ± 9.86°, p = 0.051, unpaired t test; LLC: wild types: 85.11 ± 35.78°, mutants: 83.78 ± 29.07°, p = 0.91, unpaired t test). N, Descriptive statistics (mean ± SD) for c-bend kinematics. For G–H, K–M, SLCs, N = 24 wild types, N = 35 mutant larvae, LLCs, N = 8 wild-types, N = 34 mutant larvae. For E, F, L, values represent median and interquartile range; for G–I, K and M values represent mean ± SD. |
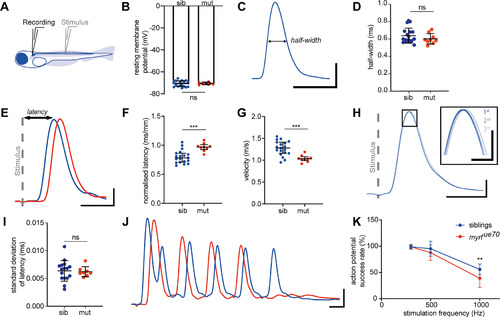
Whole cell current-clamp recordings from Mauthner cells demonstrate slower conduction velocity times and abnormal spiking profiles in myrfue70 mutants. A, Electrophysiological preparation for recording from Mauthner neuron in a whole-cell current clamp configuration while stimulating with an extracellular monopolar field electrode midway through the spinal cord. B, Resting membrane potential is unchanged in siblings (n = 18 cells): −70.82 ± 2.76 mV, mutants (n = 6 cells): −70.68 ± 1.25 mV, p = 0.9077 at 6 dpf. C, Sample trace of an action potential recorded at 6 dpf in a wild-type fish illustrating the measurement of half-width. Half-width is described as width of action potential (ms) at its half height. D, Half-width of action potential is unchanged [siblings (n = 18 cells): 0.64 ± 0.09 ms, mutants (n = 9 cells): 0.60 ± 0.06 ms, p = 0.2610 at 6 dpf]. E, An example of current–clamp recording from Mauthner neuron in a 6 dpf wild type and mutant following field stimulation (stimulus artifact is indicated by a gray dashed line). Latency is described as time from the onset of stimulus artifact to the peak of action potential. F, Normalized action potential latency is increased in mutants at 6 dpf [siblings (n = 19 cells): 0.80 ± 0.11 ms/mm, mutants (n = 9 cells): 0.97 ± 0.07 ms/mm, p = 0.0003 at 6 dpf]. G, Conduction velocity of Mauthner action potentials is significantly decreased in mutant larvae [siblings (n = 19 cells): 1.27 ± 0.17 m/s, mutants (n = 9 cells): 1.04 ± 0.08 m/s, p 0.0005 at 6 dpf]. H, Sample traces of three subsequent action potentials recorded from the same wild-type Mauthner cell at 6 dpf superimposed and aligned to the peak of stimulus artifact. The area outlined by the rectangle is magnified in the inset and demonstrates slight imprecision of action potential arrival. I, Precision of action potential arrival is comparable in siblings and mutants [siblings (n = 16 cells): 0.0064 ± 0.0019 ms, mutants (n = 8 cells): 0.0062 ± 0.0009 ms, p = 0.8166 at 6 dpf]. J, Sample trace of a train of action potentials fired following 10 stimuli at 1000 Hz at 6 dpf in a myrfue70 mutant and sibling. K, Mauthner neurons in mutant larvae do not sustain prolonged action potential trains of high-frequency stimulation [siblings (n = 19 cells): 55.79 ± 10.17% mutants (n = 9 cells): 38.89 ± 17.64% at 6 dpf, p = 0.0014 at 6 dpf]. For B, D, F, G, I, K, error bars represent mean ± SD. Unpaired t test for B, D, F, G, I and a two-way ANOVA for K. Scale bars: 10 mV and 1 ms (C, E, H, J) and 5 mV and 200 μs (H, inset). PHENOTYPE:
|

Unillustrated author statements PHENOTYPE:
|