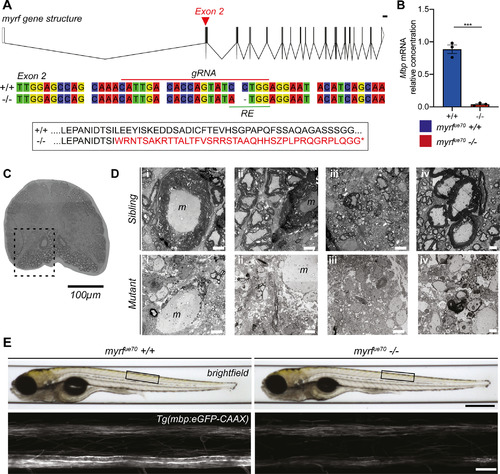
myrfue70 mutants display a gross reduction in the level of CNS myelination at the adult and larval stages. A, top, myrf gene structure composed of 27 exons. Red arrowhead marks the location of the mutation in exon 2. Scale bar: 1000 bp. Schematic created using http://wormweb.org. Middle, Wild-type and mutant nucleotide sequences spanning the mutagenesis site. The gRNA target site (red line) and restriction enzyme (RE) recognition site (green line) are labeled. Bottom, Amino acid sequence indicating that the myrfue70 mutation results in shift in the open reading frame leading to downstream coding for a premature stop codon (*). B, The relative concentration of mbp mRNA is reduced by 95% in mutants (0.04 ± 0.03 au) compared with wild types (1.003 ± 0.13 au, p = 0.0002, unpaired t test, N = 3 adult brains per genotype). Error bars represent mean ± SD. C, Transverse section of the spinal cord in an adult myrfue70 sibling showing extensive myelination of ventral spinal cord (dashed box). 20× objective. Scale bar: 100 µm. D, TEM images of the spinal cord in the region of the ventral spinal tract (outlined in C) in myrfue70 adult siblings (top) and mutants (bottom). Panels i–iv display different fields of view within the region of interest. Thick myelin sheaths are clearly visible in siblings, particularly surrounding the Mauthner axon. There is a lack of myelin surrounding the Mauthner axon in the mutant sample, and distinct reduction in the level of myelination in the remainder of surrounding spinal cord. Occasional hypomyelinated and dysmyelinated axons can be observed in the mutant samples. Scale bar: 5 µm (panels i–iii) and 1 µm (panel iv). m, Mauthner axon. E, top, Brightfield images of myrfue70 wild-type and mutant larvae at 6 dpf. Black box defines the anatomic region imaged across animals. Scale bar: 0.5 mm. Bottom, Confocal microscopy images of the spinal cord at 6 dpf in myrfue70 Tg(mbp:eGFP-CAAX) larvae. Scale bar: 20 µm.
|
