
Figure 5
- ID
- ZDB-FIG-211029-139
- Publication
- Lam et al., 2021 - Systems Analysis Reveals Ageing-Related Perturbations in Retinoids and Sex Hormones in Alzheimer's and Parkinson's Diseases
- Other Figures
- All Figure Page
- Back to All Figure Page
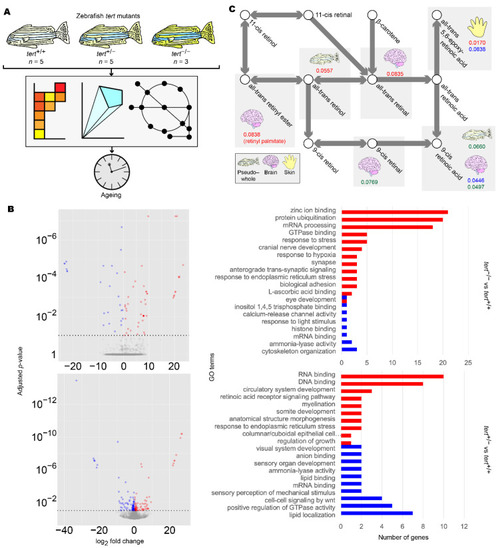
Summary of zebrafish tert mutant analysis. (A) Workflow for the analysis of zebrafish tert mutants. (B) Differentially expressed gene (DEG) (left panels) and gene set enrichment (GSE) analysis (right panels) of zebrafish brain samples. DEG and GSE analyses were performed on zebrafish tert mutant brain expression data for tert−/− (upper panels) and tert+/− (lower panels), using tert+/+ as a reference. Methods and colour keys are as in Figure 2. For muscle, liver, skin, and pseudo-whole animal analyses, refer to Figure S3. For full data, refer to Supplementary Data S5. (C) Reporter metabolite analysis of zebrafish samples. DEG data were overlaid on ZebraGEM2.1 to determine reporter metabolites. Shown are reporter metabolites with p < 0.1 within the retinoic acid metabolic pathway. Red numbers indicate p-values in tert−/− compared to tert+/+. Blue numbers indicate p-values in tert+/− compared to tert+/+. Green numbers indicate p-values in tert−/− compared to tert+/−. Tissues are indicated with icons. For full data, refer to Supplementary Data S6. |