
- Title
-
Systems Analysis Reveals Ageing-Related Perturbations in Retinoids and Sex Hormones in Alzheimer's and Parkinson's Diseases
- Authors
- Lam, S., Hartmann, N., Benfeitas, R., Zhang, C., Arif, M., Turkez, H., Uhlén, M., Englert, C., Knight, R., Mardinoglu, A.
- Source
- Full text @ Biomedicines

Overview and exploratory data analysis. (A) Workflow for the analysis of human AD and PD samples. (B) AD and PD samples were clustered into k clusters without supervision on the basis of normalised expression counts. Results are shown for k = 3 and 1000 bootstrap replicates. Colour bars indicate cluster identity for each sample. For 2 ≤ k ≤ 7, refer to Figure S1. (C) Normalised expression data from AD, PD, and control samples were projected onto 2-D space using t-distributed stochastic neighbour embedding (t-SNE). Points are coloured according to cluster assignment by unsupervised clustering. For further data visualisation, refer to Figure S2. |
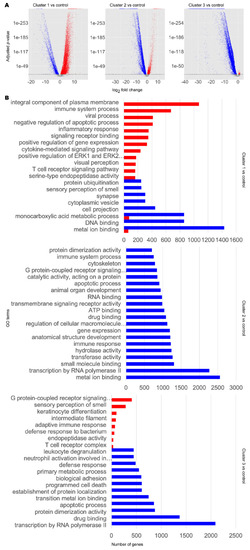
Transcriptomic and functional characterisation of AD and PD subclasses. Differentially expressed gene (DEG) analysis and gene set enrichment (GSE) analysis were performed for AD and PD and control samples for each disease cluster, using the control cluster as reference. (A) DEG results. Significant DEGs were determined as those with a Benjamini–Hochberg adjusted p-value at or below a cut-off of 1 × 10⁻¹⁰. Upregulated significant DEGs are coloured red. Downregulated significant DEGs are coloured blue. Non-significant DEGs are coloured grey. (B) Selected significantly enriched GO terms by number of genes as determined by GSE analysis. Red bars indicate upregulated GO terms. Blue bars indicate downregulated GO terms. For full data, refer to Supplementary Data S1. |

Metabolic characterisation of AD and PD subclasses. Flux balance analysis (FBA) was performed on iADPD1-3 genome-scale metabolic models (GEMs), and flux values were compared with those of iADPDControl. Key metabolites and reactions within the androgen metabolism pathway are shown and key dysregulations are displayed as coloured arrows: red indicates increased flux compared to iADPDControl; blue indicates decreased flux compared to iADPDControl. Dysregulations associated to each GEM are shown in coloured boxes. The dashed line indicates multiple reactions are involved. Human Metabolic Reactions (HMR) identifiers are shown for androgen metabolism reactions with dysregulated fluxes. For full data, refer to Supplementary Data S2. |
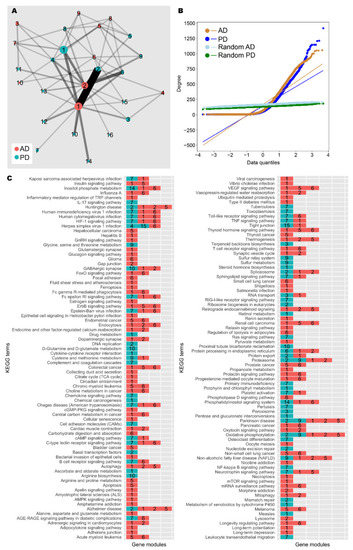
Network analysis of AD and PD gene co-expression modules. (A) Gene co-expression networks were constructed from transcriptomic data from AD and PD samples. Community analysis was used to identify gene modules (see the Materials and Methods section). Modules with at least 30 genes are shown as nodes. Node size indicates number of genes. Nodes are coloured by network of origin and numbered in descending order of module size. Shared genes between modules are shown as edges. Edge weight indicates number of shared genes. (B) Degree distribution of AD, PD, and random networks. (C) Enrichment analysis was performed on gene modules containing at least 30 genes using the KEGG database (see the Materials and Methods section). Significantly enriched gene modules are shown as coloured, numbered blocks. Colour and number keys are as in (A). |
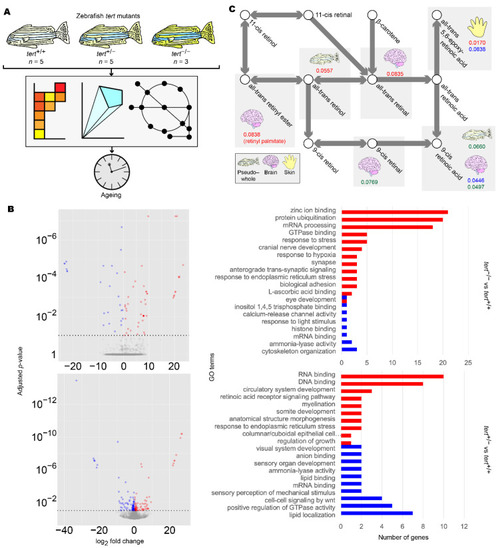
Summary of zebrafish tert mutant analysis. (A) Workflow for the analysis of zebrafish tert mutants. (B) Differentially expressed gene (DEG) (left panels) and gene set enrichment (GSE) analysis (right panels) of zebrafish brain samples. DEG and GSE analyses were performed on zebrafish tert mutant brain expression data for tert−/− (upper panels) and tert+/− (lower panels), using tert+/+ as a reference. Methods and colour keys are as in Figure 2. For muscle, liver, skin, and pseudo-whole animal analyses, refer to Figure S3. For full data, refer to Supplementary Data S5. (C) Reporter metabolite analysis of zebrafish samples. DEG data were overlaid on ZebraGEM2.1 to determine reporter metabolites. Shown are reporter metabolites with p < 0.1 within the retinoic acid metabolic pathway. Red numbers indicate p-values in tert−/− compared to tert+/+. Blue numbers indicate p-values in tert+/− compared to tert+/+. Green numbers indicate p-values in tert−/− compared to tert+/−. Tissues are indicated with icons. For full data, refer to Supplementary Data S6. |