
Figure 2
- ID
- ZDB-FIG-211029-136
- Publication
- Lam et al., 2021 - Systems Analysis Reveals Ageing-Related Perturbations in Retinoids and Sex Hormones in Alzheimer's and Parkinson's Diseases
- Other Figures
- All Figure Page
- Back to All Figure Page
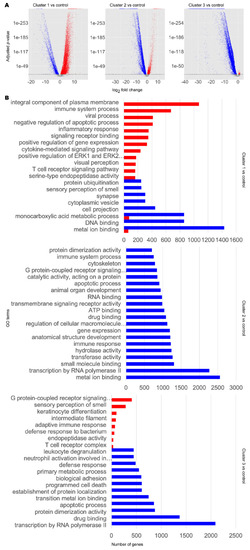
Transcriptomic and functional characterisation of AD and PD subclasses. Differentially expressed gene (DEG) analysis and gene set enrichment (GSE) analysis were performed for AD and PD and control samples for each disease cluster, using the control cluster as reference. (A) DEG results. Significant DEGs were determined as those with a Benjamini–Hochberg adjusted p-value at or below a cut-off of 1 × 10⁻¹⁰. Upregulated significant DEGs are coloured red. Downregulated significant DEGs are coloured blue. Non-significant DEGs are coloured grey. (B) Selected significantly enriched GO terms by number of genes as determined by GSE analysis. Red bars indicate upregulated GO terms. Blue bars indicate downregulated GO terms. For full data, refer to Supplementary Data S1. |