
Figure 6
- ID
- ZDB-FIG-211011-13
- Publication
- Zang et al., 2021 - Circadian regulation of vertebrate cone photoreceptor function
- Other Figures
- All Figure Page
- Back to All Figure Page
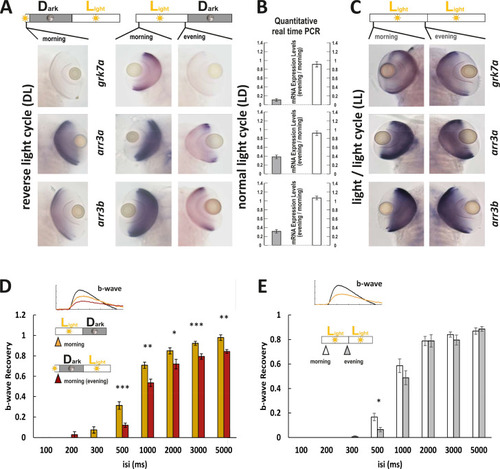
(A and C) In situ hybridization images using arr3a, arr3b, and grk7a as probes. Tissues were collected from either reverse light cycle (DL) (A, left panel), normal light cycle (LD) (A, right panel) or light/light cycle (LL) (C) zebrafish larva (5 days post fertilization [dpf]) at the indicated time points. A reversal in the light cycle from LD to DL is reflected in the reversal of the in situ hybridization signal, with low expression levels observed at 9 o’clock (A). The ratio of gene expression levels between evening (ZT13) and morning (ZT1) for fish raised under a normal LD cycle or under LL is shown in (B). In contrast to the observed circadian regulation under LD conditions, under LL conditions, expression levels remain continuously elevated not displaying any circadian fluctuation (B, C). (D) A reversal of the light cycle is reflected in a corresponding reversal of b-wave recovery. The comparison of b-wave recovery of LD and DL larvae recorded at the same time in the morning clearly indicates that immediately before darkness, b-wave recovery rates are reduced. Data are presented as mean ± sem (n = 16 larvae raised in LD; n = 9 larvae raised in DL) of three independent experiments. t-tests and nonparametric tests were performed by GraphPad Prism version 8. Plots with individual data points were provided in metadata from DRYAD. p = 0.001 at 500 ms interstimulus interval (isi); p = 0.0019 at 1000 ms isi; p = 0.0221 at 2000 ms isi; p = 0.0009 at 3000 ms isi; p = 0.0022 at 5000 ms isi. *p<0.05; **p<0.01; ***p≤0.001. (E) No changes in b-wave recovery between morning and evening can be observed under constant light conditions (LL). Data are presented as mean ± sem (n = 15 in the morning; n = 12 in the evening) of three independent experiments. t-tests and nonparametric tests were performed by GraphPad Prism version 8. p = 0.0107 at 500 ms isi; *p<0.05. Metadata can be downloaded from DRYAD.
|