
Figure 5
- ID
- ZDB-FIG-211011-12
- Publication
- Zang et al., 2021 - Circadian regulation of vertebrate cone photoreceptor function
- Other Figures
- All Figure Page
- Back to All Figure Page
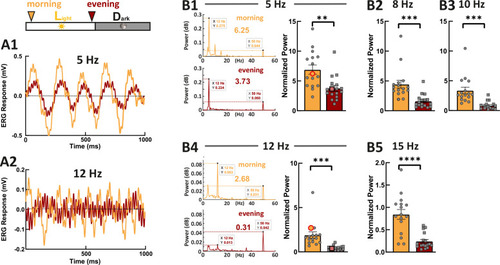
Examples show the flicker electroretinogram (ERG) responses to 5 Hz stimulus (A1) and to 12 Hz stimulus (A2). Example fast Fourier transform (FFT) power plots generated by MATLAB for responses (A1) and (A2) are shown in (B1) and (B4). These four example power plot results are highlighted in the corresponding summarized normalized power results in (B1) and (B2). The power of given frequency was normalized against the power at 50 Hz (line noise). The rest of the summarized plots of normalized power are shown in B2, B3, and B5. t-tests and nonparametric tests were performed by GraphPad Prism version 8. p = 0.0016 at 5 Hz (B1); p = 0.0005 at 8 Hz (B2); p = 0.0001 at 10 Hz (B3); p = 0.0001 at 12 Hz (B4); p<0.0001 at 15 Hz (B5). **p<0.01; ***p≤0.001; ****p≤0.0001. Metadata can be downloaded from DRYAD.
|