
Figure 1
- ID
- ZDB-FIG-211011-1
- Publication
- Zang et al., 2021 - Circadian regulation of vertebrate cone photoreceptor function
- Other Figures
- All Figure Page
- Back to All Figure Page
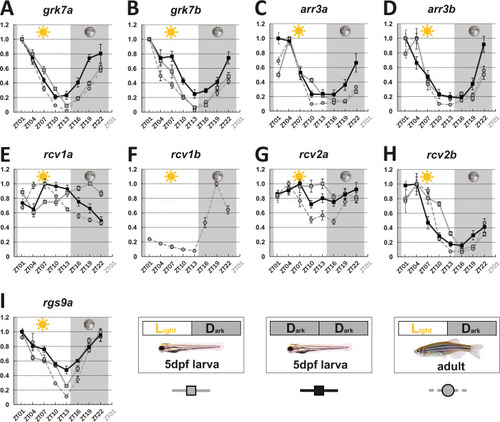
mRNA levels of visual transduction decay genes in the eye of adult and larval zebrafish were measured by qRT-PCR over a 24-hour-period. (A-I). Eye tissues from larval fish either raised under a normal light/dark cycle (LD / gray squares) or in continuous darkness (DD / black squares) and from adult LD zebrafish (gray circles) were collected at eight different time points throughout the day. The name of the analyzed gene transcripts is given on top of each graph. The time point of collection is indicated along the x-axis with ZT01 being the time point one hour after the light was turned on. Dark periods are indicated by the moon symbol and highlighted in gray, whereas the periods under regular light conditions are indicated by the sun symbol and shown in white. For better orientation the different conditions are summarized at the bottom of the figure. Data represents the mean ± standard error of the mean (s.e.m). Statistical analysis was performed by “RAIN” as previously described (Thaben and Westermark, 2014). Statistics information and the numbers of independent repeats are provided in Supplementary file 1. Metadata can be downloaded from DRYAD.
|