FIGURE

Fig. 3

ID
ZDB-FIG-211009-8
Publication
Jang et al., 2021 - Epigenetic dynamics shaping melanophore and iridophore cell fate in zebrafish
Other Figures
All Figure Page
Back to All Figure Page
Fig. 3

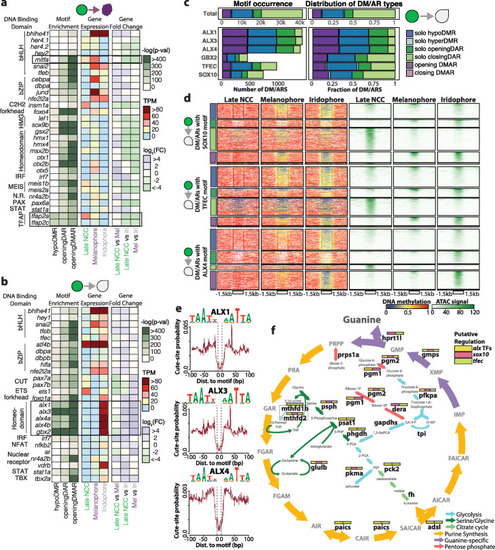
Motif enrichment analysis reveals alx transcription factor family as putative regulator of iridophore development. a, b Heatmaps representing motif enrichment, gene expression, and gene fold change of transcription factors when comparing late NCC differentiation into melanophores (a) and iridophores (b). c Bar plots representing frequency and distribution of iridophore-associated DM/ARs with a particular TF motif. d Heatmaps representing DNA methylation and ATAC signal across iridophore-associated DM/ARs with specific TF motifs. e ATAC-seq footprint signatures of alx transcription factor candidates. f Model of guanine synthesis cycle. Iridophore-specific DEGs are shown in bold. Boxes above DEGs are color-coded based on detection of CREs containing TF motifs within 50 kb of DEG promoters

Expression Data

Expression Detail
Antibody Labeling
Phenotype Data
Fish:
Observed In:
Stage Range: 10-13 somites to Day 6

Phenotype Detail
Acknowledgments
This image is the copyrighted work of the attributed author or publisher, and ZFIN has permission only to display this image to its users. Additional permissions should be obtained from the applicable author or publisher of the image. Full text @ Genome Biol.