FIGURE

Fig. 1

ID
ZDB-FIG-211009-13
Publication
Jang et al., 2021 - Epigenetic dynamics shaping melanophore and iridophore cell fate in zebrafish
Other Figures
All Figure Page
Back to All Figure Page
Fig. 1

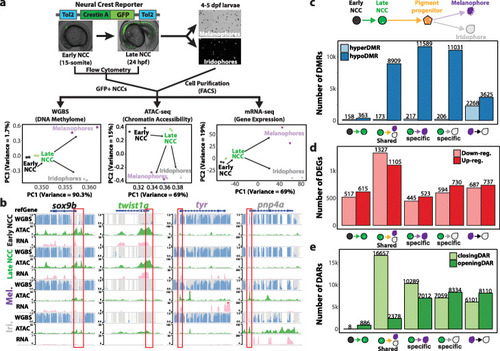
Epigenetic and transcriptomic dynamics of neural crest cell differentiation into pigment cells. a Schematic of sample collection method and principle component analysis on the DNA methylome, chromatin accessibility, and transcriptome of each cell type. b WashU Epigenome browser views of zebrafish early neural crest marker gene (sox9b), neural crest marker gene (twist1a), melanophore marker gene (tyr), and iridophore marker gene (pnp4a). Grey bars represent CpG sites while height of the blue bars indicates methylation levels. The red box demarcates promoter regions of marker genes. c–e Bar charts illustrating the number of DMRs (c), DEGs (d), and DARs (e) when comparing early NCCs, late NCCs, melanophores, and iridophores. DMRs were identified using DSS (p value < 0.001)

Expression Data
Gene:
Fish:
Anatomical Terms:
Stage Range: 10-13 somites to Day 5

Expression Detail
Antibody Labeling
Phenotype Data
Fish:
Observed In:
Stage Range: 10-13 somites to Day 5

Phenotype Detail
Acknowledgments
This image is the copyrighted work of the attributed author or publisher, and ZFIN has permission only to display this image to its users. Additional permissions should be obtained from the applicable author or publisher of the image. Full text @ Genome Biol.