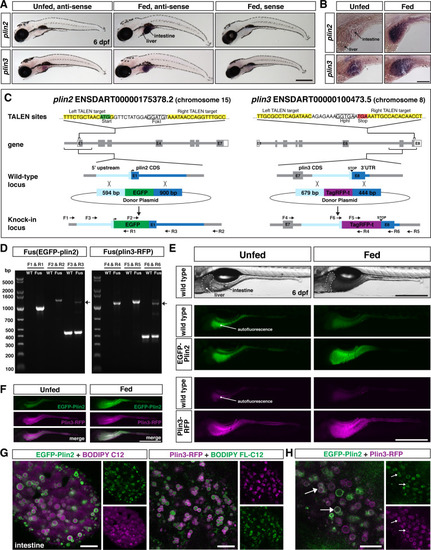
(A,B) Representative images of whole-mount in situ hybridization (ISH) with probes against zebrafish plin2 (ENSDARG00000042332) and zgc: 77,486 (plin3/4/5) (ENSDARG00000013711) at 6 days post fertilization (dpf) either unfed or following feeding with a high-fat meal for 90 min. ISH was performed three times for each gene with n = 10 larvae per probe per experiment; scale = 500 µm (A), scale = 100 µm (B). Plin2 is expressed in the intestine only following a high-fat meal whereas plin3 is expressed in the intestine in unfed fish and has stronger expression following a high-fat meal. (C) Overview of the location and strategy used for TALEN-mediated genome editing. EGFP was fused in-frame at the N-terminus of plin2. TALEN targets in plin2 are located in exon 1 of the plin2-203 ENSDART00000175378.2 transcript and flank a FokI restriction site, loss of which was used to confirm cutting activity. A donor plasmid with the coding sequence for EGFP and plin2 homology arms was co-injected with TALEN mRNA into one-cell stage embryos to be used as a template for homology directed repair. mTag-RFP-t was fused in-frame at the C-terminus of plin3. TALEN targets were located in exon 8 of the plin3 ENSDART00000100473.5 transcript and flank the termination codon and an HphI restriction site, loss of which was used to confirm cutting activity. A donor plasmid with the coding sequence for mTagRFP-t and plin3 homology arms was co-injected with TALEN mRNA into one-cell stage embryos to be used as a template for homology directed repair. (D) Following identification of fluorescent embryos in the F1 generation, RT-PCR and sequencing of genomic DNA using the primers noted on the knock-in loci depicted in (C) were used to confirm successful in-frame integration of the fluorescent tags. The size of the amplicons expected for correct integration were as follows: F1–R1 1033 bp, F2–R2 1340 bp, F3–R3 440 bp for wild-type (WT) and 1224 bp for Fus(EGFP-plin2) fusion, F4–R4 1218 bp, F5–R5 1274 bp, F6–R6 401 bp for WT and 1187 for Fus(plin3-RFP). Arrows indicate the larger amplicon in heterozygous fish carrying the fusion alleles. (E) Imaging in live larvae (6 dpf) reveals expression of EGFP-Plin2 only in the intestine of larvae fed a high-fat meal (7 hr post-start of 2 hr meal) and Plin3-RFP is expressed in the intestine of both unfed and fed larvae (4.5 hr post-start of 2 hr meal, larvae are heterozygous for the fusion proteins; the lumen of the intestine has strong autofluorescence in WT and transgenic fish; see Figure 1—figure supplement 2 for images of whole fish). Scale = 500 µm. (F) Examples of larvae expressing both EGFP-Plin2 and Plin3-RFP (7 hr post start of meal). Scale = 500 µm. For (E and F), images are representative of at least 15 fish from three independent clutches. (G) EGFP-Plin2 (green) and Plin3-RFP (magenta) label the lipid droplet surface in the intestine of 6 dpf larvae fed with a high-fat meal containing either BODIPY 558/568-C12 (magenta) or BODIPY FL-C12 (green) to label the stored lipids. Note the 558/568-C12 is not fully incorporated into stored lipid and is also found diffuse in the cytoplasm. Scale = 10 µm. (H) EGFP-Plin2 and Plin3-RFP can decorate the same lipid droplets in the intestine. Arrows denote examples of dual-labeled droplets, scale = 10 µm.