
Figure 3
- ID
- ZDB-FIG-210927-41
- Publication
- Wilson et al., 2021 - Imaging cytoplasmic lipid droplets in vivo with fluorescent perilipin 2 and perilipin 3 knock-in zebrafish
- Other Figures
- All Figure Page
- Back to All Figure Page
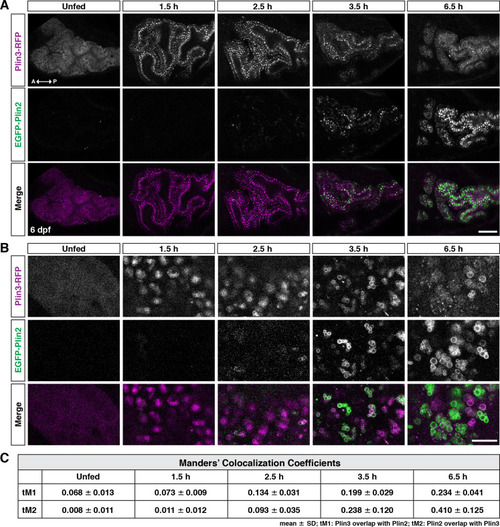
(A) Lateral views of the anterior intestine in unfed larvae and in larvae at different time-points following the start of feeding with a high-fat meal for 1 hr. Fish were heterozygous for both Fus(plin3-RFP) and Fus(EGFP-plin2). Images are representative of three independent experiments (15–25 fish per experiment); data presented are from one experiment. Scale = 50 µm. (B) Higher magnification micrographs of lipid droplets highlight the transition from Plin3-RFP to EGFP-Plin2 on the surface of lipid droplets over time after a high-fat meal. Scale = 10 µm. (C) Manders’ colocalization coefficients for a subset of images was quantified following Costes method for automatic thresholding. Mean ± SD, n = 4 fish per time-point.
|
| Genes: | |
|---|---|
| Fish: | |
| Condition: | |
| Anatomical Terms: | |
| Stage: | Day 6 |
| Fish: | |
|---|---|
| Condition: | |
| Observed In: | |
| Stage: | Day 6 |