|
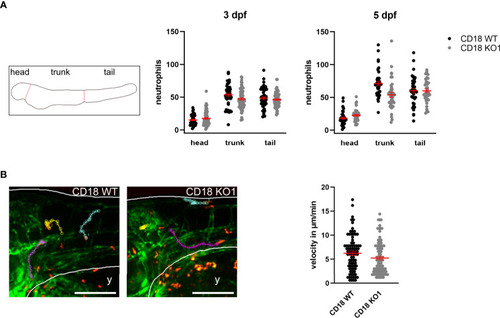
Analysis of neutrophil count and random migration at steady state. (A) Left: Schematic of zebrafish larvae for analyzing neutrophil distribution in head, trunk, and tail. Middle and right: Distribution of neutrophils in CD18 WT and CD18 KO1 zebrafish larvae at 3 dpf and 5 dpf. Mean ± sem of ≥ 44 individual larvae of ≥ 3 independent experiments. (B) Left: Exemplary maximum intensity projections of randomly migrating neutrophils in the head area of CD18 WT (left) and CD18 KO1 (right) zebrafish larvae at 5 dpf. Endothelial cells are shown in green. Neutrophils are shown in red. Y indicates yolk. Three representative migration tracks of neutrophils within 15 min are highlighted. Scale bars represent 200 µm. Right: Mean migration velocity of individual neutrophils. Mean ± sem of ≥ 84 individual neutrophils of ≥ 5 independent experiments. Unpaired t-test.
|