
Figure 5.
- ID
- ZDB-FIG-210922-32
- Publication
- Katz et al., 2021 - Whole-organism 3D quantitative characterization of zebrafish melanin by silver deposition micro-CT
- Other Figures
- All Figure Page
- Back to All Figure Page
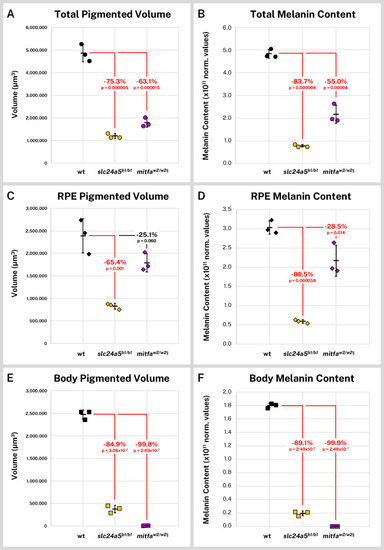
Wild-type (wt, n = 3), slc24a5b1/b1 (n = 3), and mitfaw2/w2 (n = 3) 5 days post-fertilization (dpf) larvae were stained with silver and micro-CT imaged under the same conditions. Normalized reconstructed intensity values (norm. values) are assumed proportional to melanin density; integrated intensity values for the segmented regions represent the melanin content of these regions. Volume and melanin content from total pigmented regions (A–B), combined right and left retinal pigment epithelia (RPE) (C–D), and pigmented regions outside the eye (E–F) are shown for all samples with percent change of mean from wt indicated. p-Values were determined by Tukey post hoc test following one-way ANOVA and considered significant at p < 0.05 (shown in red). § = head segments only analyzed. Error bars = standard deviation from average.
|