
Figure 4
- ID
- ZDB-FIG-210922-30
- Publication
- Katz et al., 2021 - Whole-organism 3D quantitative characterization of zebrafish melanin by silver deposition micro-CT
- Other Figures
- All Figure Page
- Back to All Figure Page
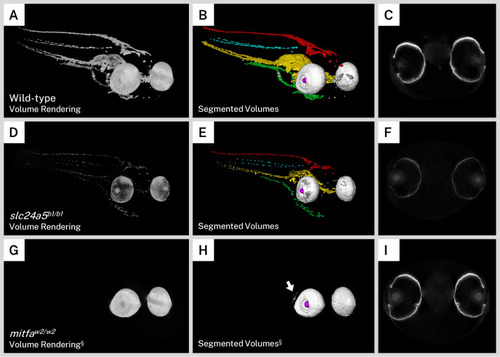
Volume renderings (A, D, G), segmented volumes (B, E, H), and representative single slices of micro-CT reconstructions through the retinal pigment epithelium (RPE; C, F, I) of representative 5 days post-fertilization (dpf) wild-type (A–C), slc24a5b1/b1 (golden; D–E), and mitfaw2/w2 (nacre or casper; G–I) larvae. In the segmented volumes, red = dorsal stripe, yellow = ventral stripe, green = yolk sac stripe, cyan = lateral stripes, white = RPE, gray = other body melanin, purple = lens. As compared to wild-type larvae, slc24a5b1/b1 mutant larvae exhibit a reduction in staining throughout the body and eyes (D) but retain the overall organization of pigment layers (E). The RPE in slc24a5b1/b1 larvae (F) is thinner than the wild-type RPE (C) with less intense staining. The mitfaw2/w2 mutant lacks all body pigment; staining is observed only in the RPE and some argentaffin material posterior to the eyes (G–H, arrow). The RPE of the mitfaw2/w2 mutant (I) is of similar thickness and staining intensity as the wild-type RPE (C). For each comparison, visualization settings were kept constant for the wild-type and mutant fish. § = head segment only shown. All stained samples analyzed in this study are shown in Figure 4—figure supplement 1.
|