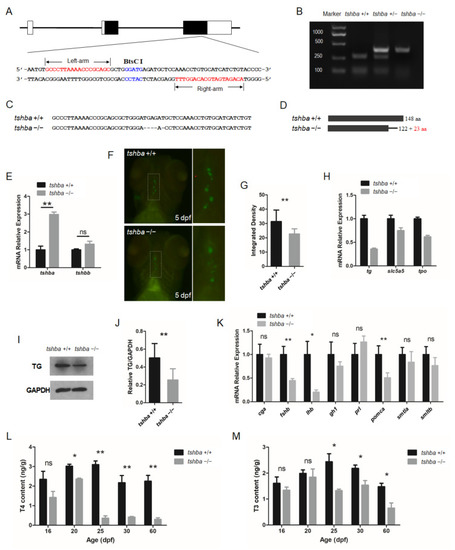
Generation of the tshba mutant zebrafish. (A) Schematic representation of the genomic structure of tshba and the targeting site on exon 3. The regions of the left and right arms are labeled above and below, respectively. The BtsCI site in the spacer is labeled above. (B) Genotyping of the tshba +/+, tshba +/−, and tshba −/− individuals represented with the un-cleaved and cleaved PCR products is indicated. (C) DNA sequences of the targeting regions of the tshba locus in wild-type and tshba mutant zebrafish. (D) Predicted putative wild-type and mutant Tshba protein structures. The 5 bp deletion generated a miscoded peptide after the 122th amino acid (AA) with the 23 miscoded AAs at the C-terminus. (E) Comparison results of quantitative RT-PCR analyses of the tshba and tshbb genes between the tshba mutant and its wild-type siblings at 5 dpf. (F) T4 immunofluorescence analyses at 5 dpf. The thyroid follicles are labeled in green for T4 with thyroxine immunofluorescence. Details of T4 immunofluorescent signals in the dotted white box are shown at high magnification. (G) Quantitative analyses of the T4 immunofluorescence signal at 5 dpf. Measurements were taken from wild-type zebrafish (n = 10) and tshba mutants (n = 9). (H) Quantitative RT-PCR analyses of TH synthesis-related genes, including the tg, slc5a5, and tpo gene in the tshba mutant and their wild-type siblings at 5 dpf. (I) Representative Western blotting of the TG protein from zebrafish at the 2 mpf stage using anti-TG antibodies. (J) Quantification of the relative expression of TG protein of the Western blot analyses. Measurements were taken from wild-type zebrafish (n = 5) and tshba mutants (n = 5). (K) Quantitative RT-PCR analyses of pituitary hormone genes, including cga, fshb, lhb, gh1, prl, pomca, smtla, and smtlb, in the tshba mutant and its wild-type sibling at 20 dpf. (L,M) Whole-body T4 levels (L) and T3 levels (M) in zebrafish at various stages. Measurements of THs were performed with three groups of wild-type zebrafish and three groups of tshba mutant zebrafish at 16, 20, 25, and 60 dpf stages. * p < 0.05; ** p < 0.01, ns: No significance.
|
